
Send data to Grafana
Expose your normalized interface counters on the collector's Prometheus endpoint, scrape them with Prometheus, and chart live per-interface traffic for every vendor in Grafana — done in the UI.
By the end of this tutorial, Grafana will show live per-interface
traffic rates for every device subscribed to your interface-counters
Model, sourced from Prelude Collector. Because the Model normalizes
interface state across vendors, a single set of panels covers all your
devices regardless of platform.
The collector's default output is Prometheus: it exposes every
collected field on a /metrics endpoint, and Prometheus scrapes it.
The pipeline is:
Device --(gNMI)--> Prelude Collector --(/metrics/collector)--> Prometheus --(query)--> Grafana
Everything on the collector side is done in the web UI. Plan on 25–35 minutes.
What you'll learn
- Stand up Prometheus + Grafana with a single
docker compose up. - Enable the collector's Prometheus output from the UI.
- Use Output Hints to expose each field the right way — counters for octets, an info series for status labels.
- Confirm Prometheus is scraping the collector before you wire Grafana.
- Import a ready-made dashboard and read vendor-normalized panels.
Prerequisites
- Prelude Collector v1.1.0 running, and you're signed in to the web UI. See Installation.
- The
interface-countersModel with a running Subscription on at least one device. If you haven't built it yet, run through Interface counters across vendors first — the steps below assume its eight normalized fields (interface-name,admin-status,oper-status,mtu,in-octets,out-octets,in-errors,out-errors). - Docker (or Podman) on the host that will run Prometheus and Grafana.
Step 1 — Stand up Prometheus and Grafana
Save this as prometheus.yml — it tells Prometheus to scrape the
collector's metrics endpoint:
global:
  scrape_interval: 15s
scrape_configs:
  - job_name: prelude-collector
    metrics_path: /metrics/collector
    static_configs:
      - targets: ["host.docker.internal:9090"]
And this as docker-compose.grafana.yml next to it:
services:
  prometheus:
    image: prom/prometheus:latest
    ports:
      - "9090:9090"
    volumes:
      - ./prometheus.yml:/etc/prometheus/prometheus.yml:ro
    restart: unless-stopped

  grafana:
    image: grafana/grafana-oss:latest
    ports:
      - "3000:3000"
    environment:
      GF_SECURITY_ADMIN_PASSWORD: change-me
    volumes:
      - grafana-data:/var/lib/grafana
    depends_on:
      - prometheus
    restart: unless-stopped

volumes:
  grafana-data:
Bring it up:
docker compose -f docker-compose.grafana.yml up -d
host.docker.internalresolves to the Docker host on Docker Desktop (macOS, Windows). On Linux, run the collector and this stack on the same Docker network and target the collector's container name, or use the host IP. The collector's metrics port (9090, next step) must be reachable from the Prometheus container.
Open Grafana at http://localhost:3000 and sign
in with admin / change-me. Leave it open — you'll come back in
Step 5.
Step 2 — Enable the collector's Prometheus output
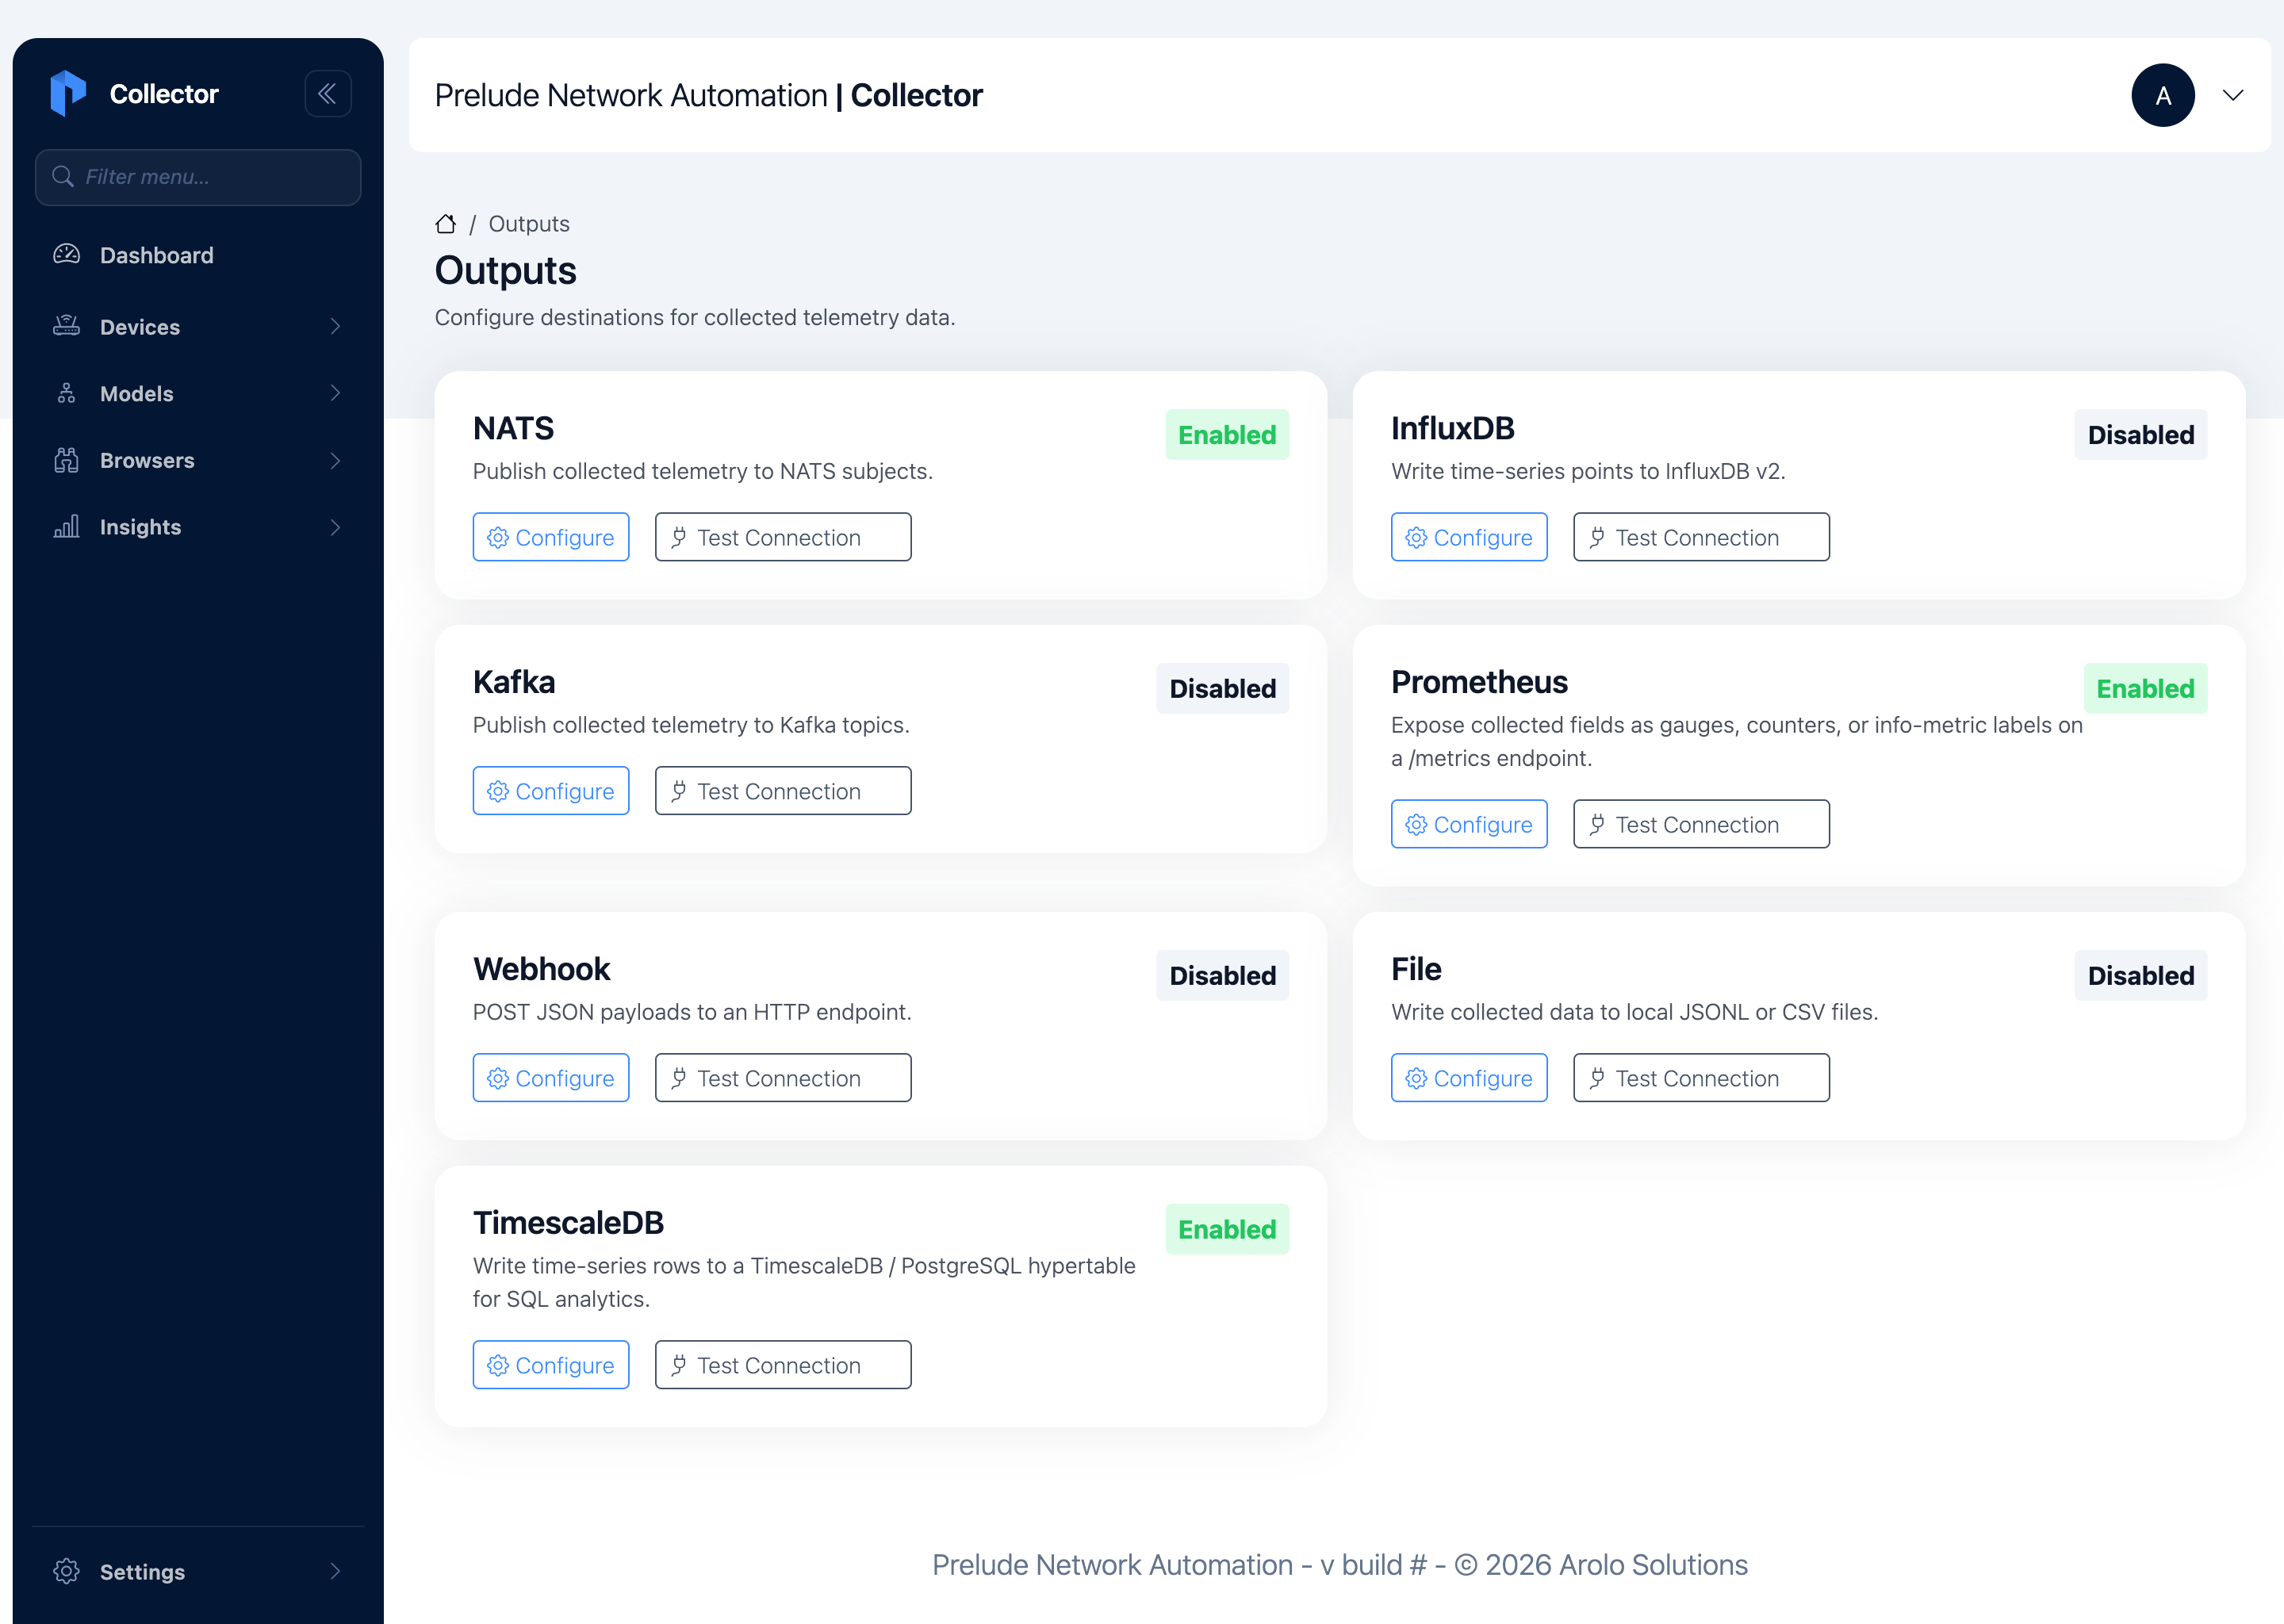
In the collector UI, go to Outputs. Each backend is a card; find Prometheus and click Configure.
Toggle Enable this backend on. The defaults — metrics path
/metrics/collector and port 9090 — already match the
prometheus.yml from Step 1, so you can leave them. Click Save
settings.
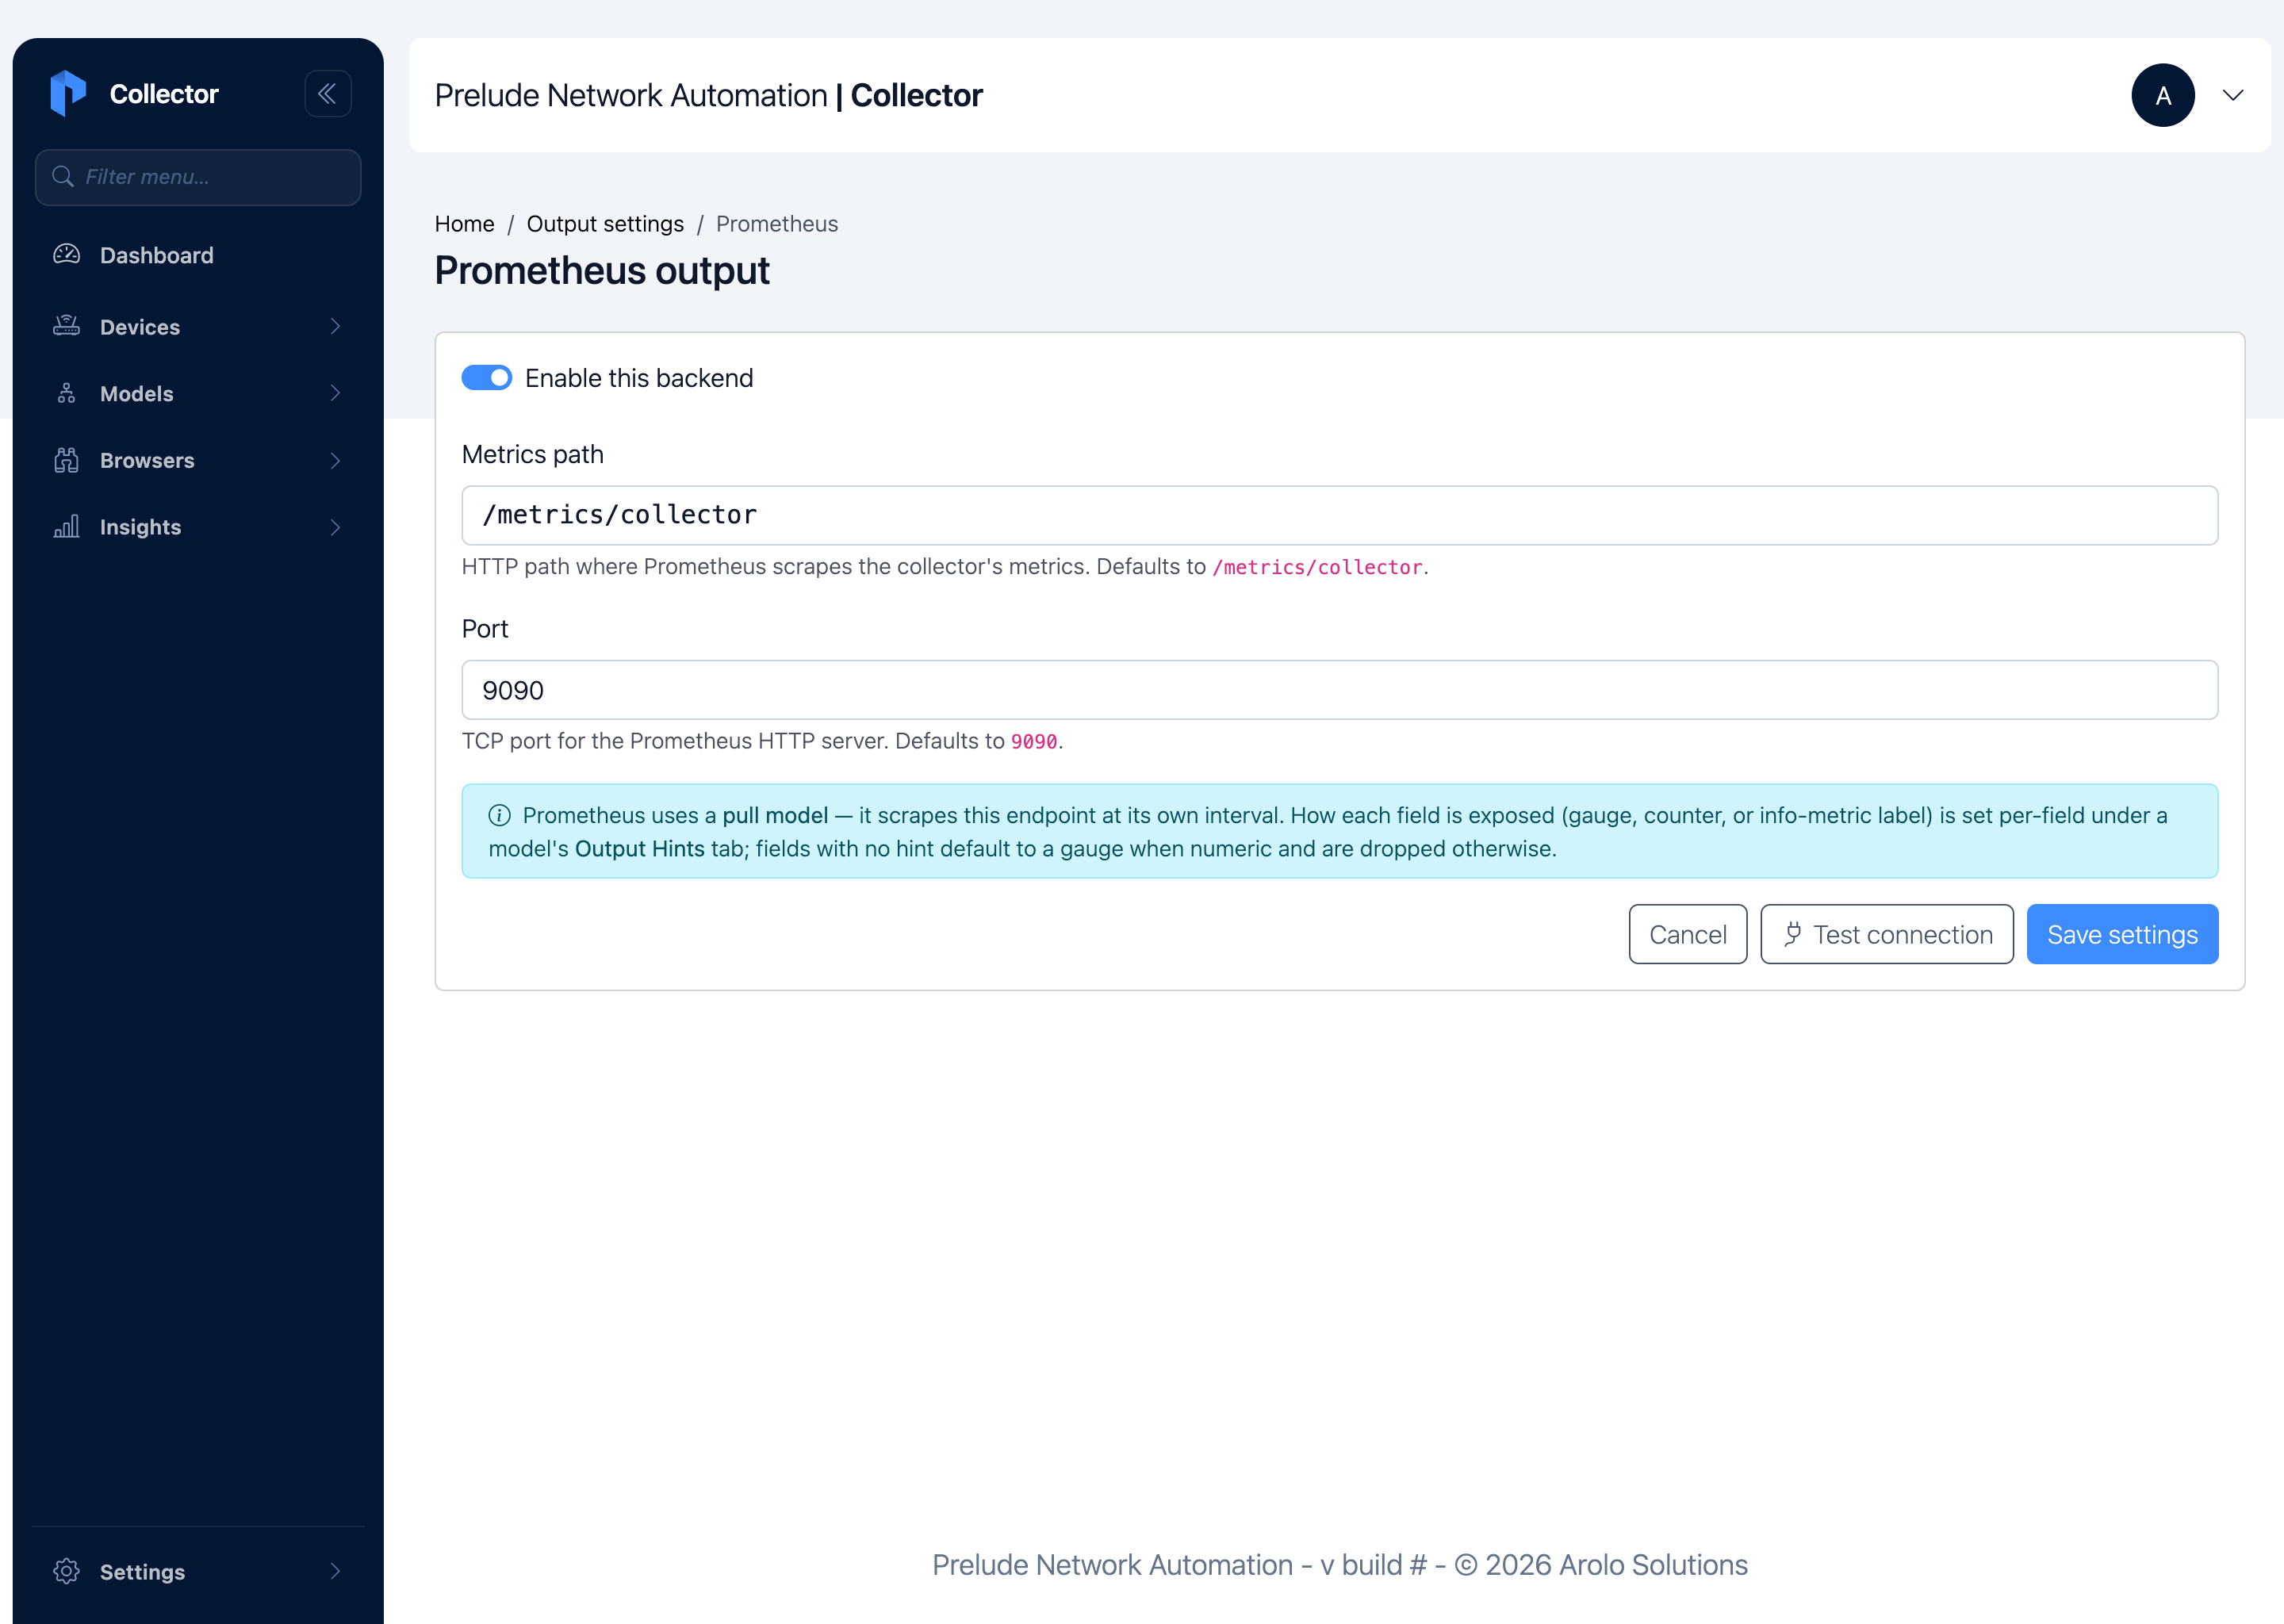
The collector now serves its metrics at
http://<collector-host>:9090/metrics/collector. Prometheus uses a
pull model, so it scrapes that endpoint on its own interval — there
is nothing to push.
Step 3 — Tell Prometheus how to read each field
By default the output exposes numeric fields as gauges and drops
non-numeric ones. That works, but interface octets are really
counters (you want rate() over them), and the status strings are
more useful as labels. Open the interface-counters Model and go
to the Output Hints tab to set a Prometheus role per field:
| Field | Role | Why |
|---|---|---|
in-octets, out-octets, in-errors, out-errors |
counter | Monotonic totals — exposed as …_total so rate() is correct. |
mtu |
gauge | A point-in-time value. |
admin-status, oper-status |
info | Attached as labels on a per-interface …_info series. |
interface-name |
(auto) | The interface name is already the key label on every series. |
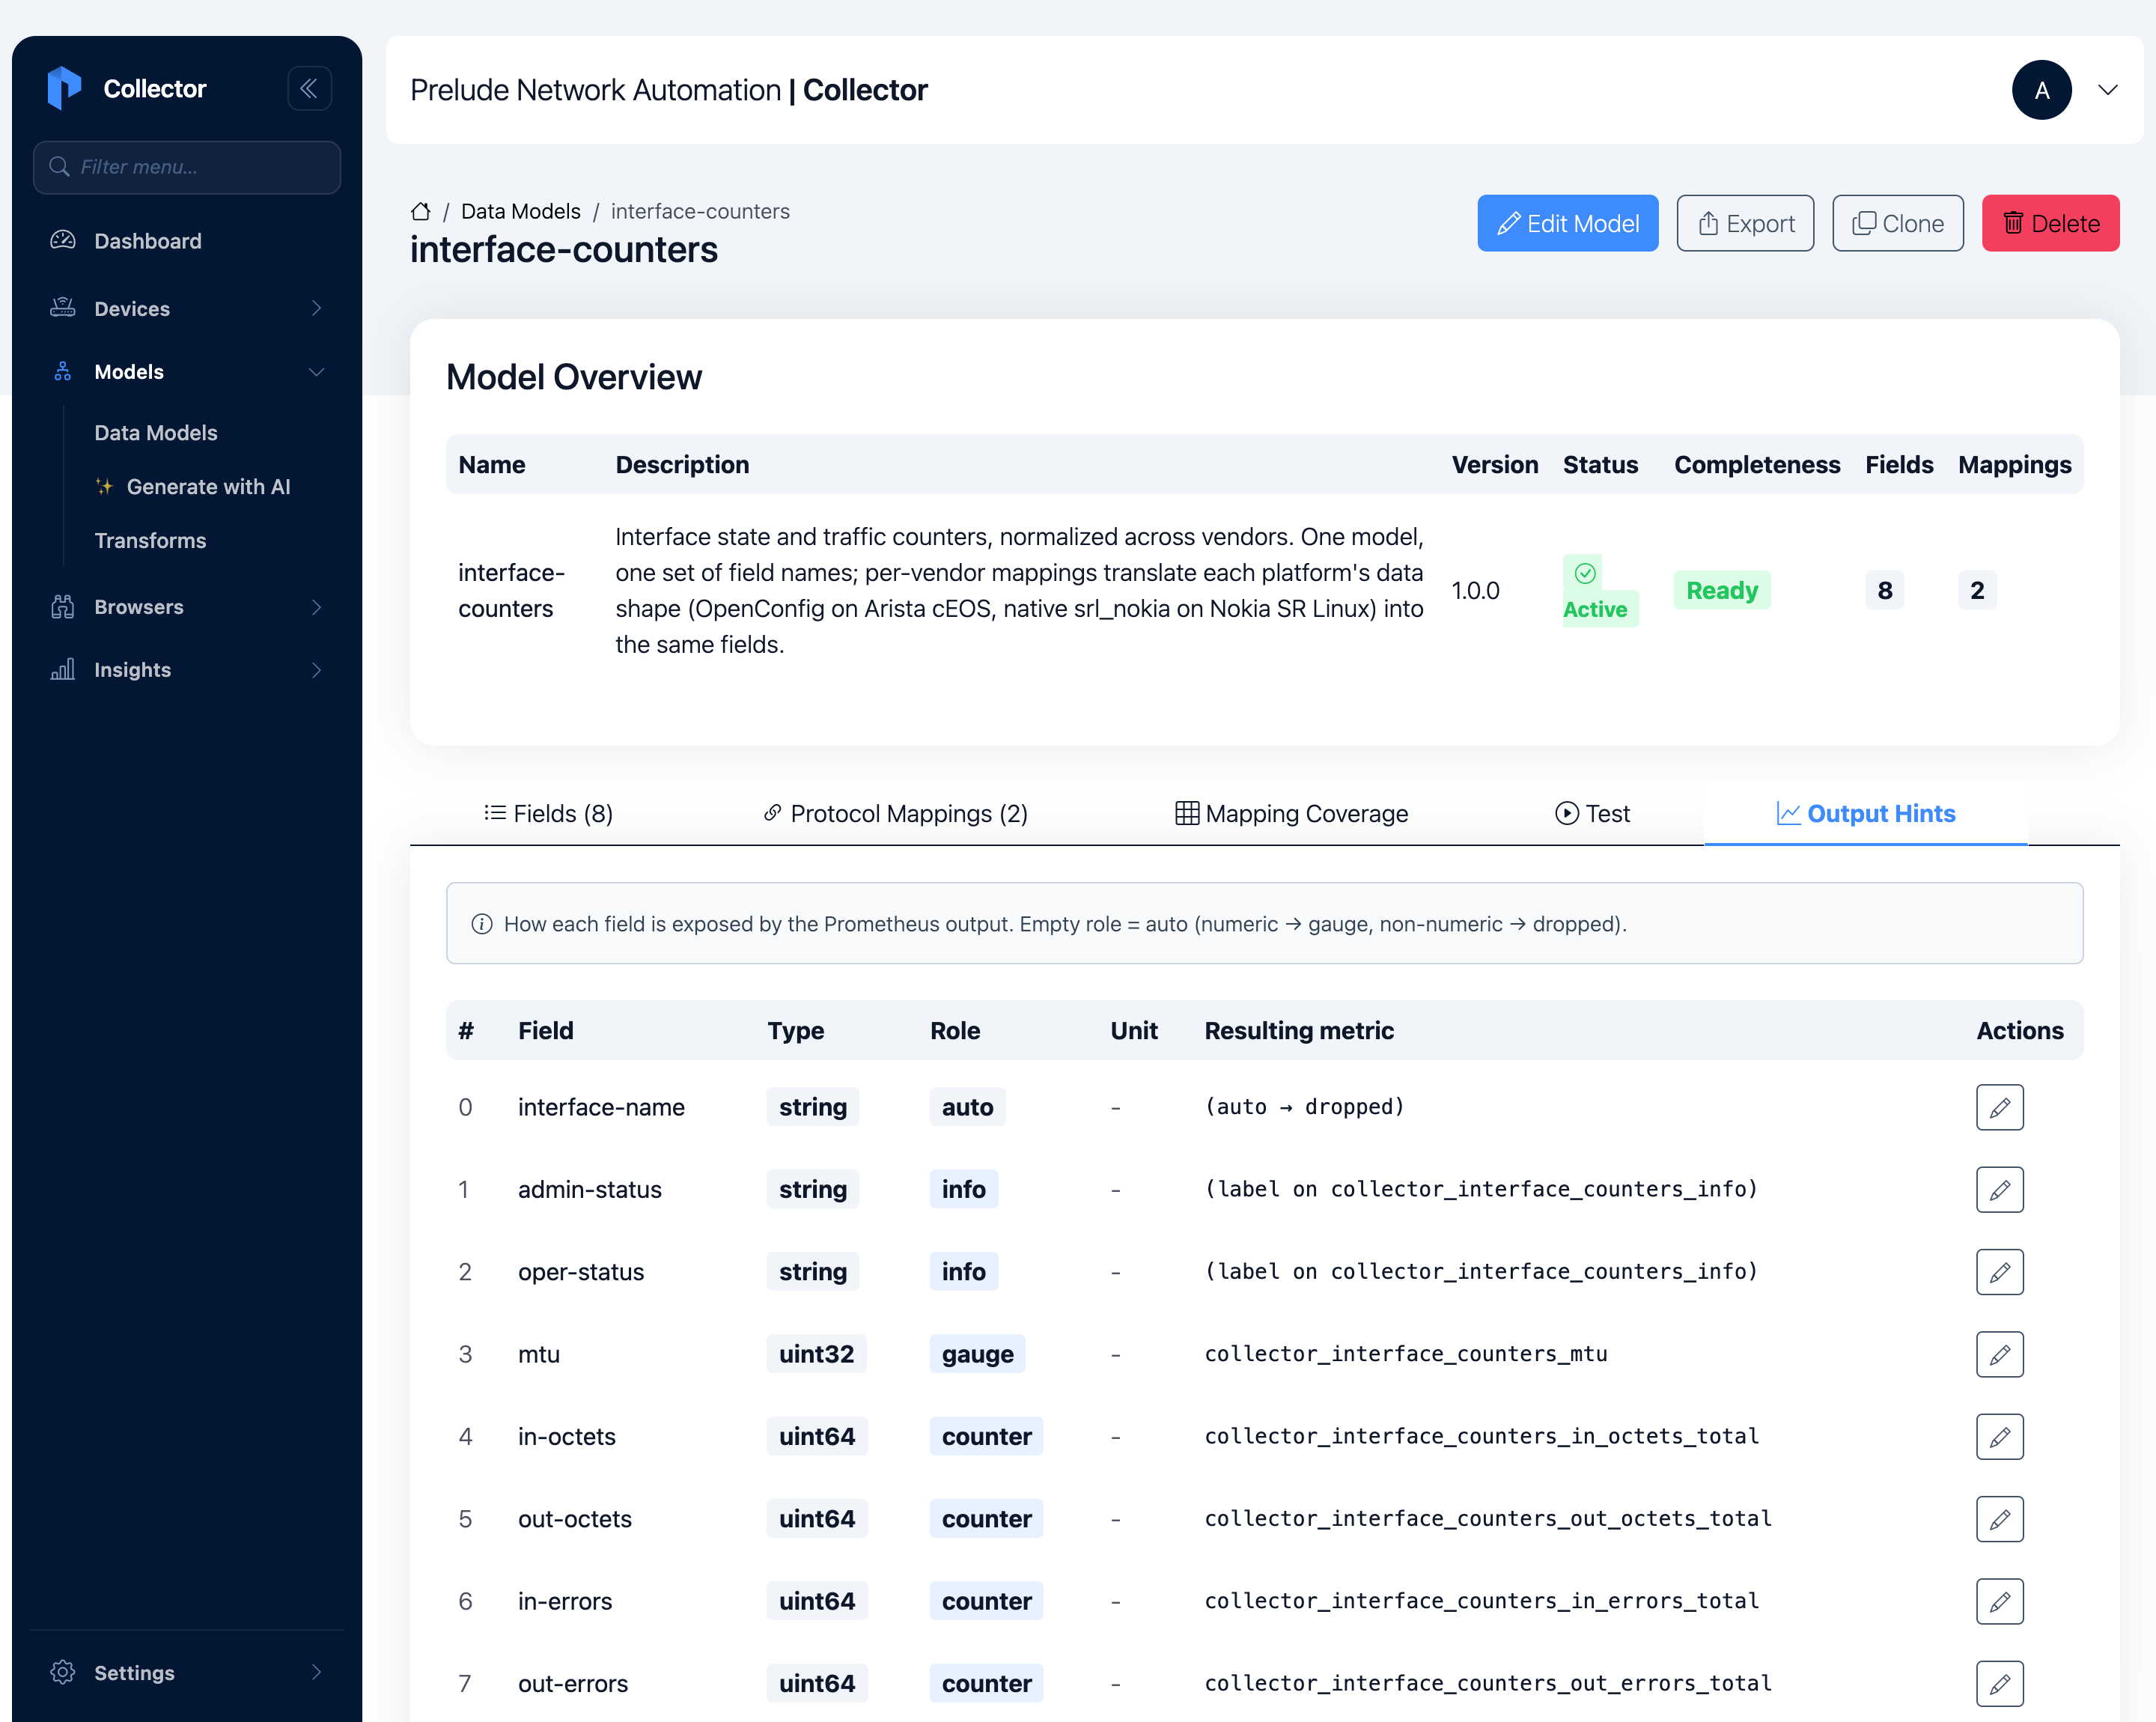
With those roles, the collector exposes:
collector_interface_counters_in_octets_total(andout_octets,in_errors,out_errors) — counters,collector_interface_counters_mtu— a gauge,collector_interface_counters_info{admin_status="up",oper_status="up", …}— the status series,
each labelled with device, device_id, and key (the interface
name) — so the same query covers every vendor.
Step 4 — Confirm Prometheus is scraping the collector
Open Prometheus at http://localhost:9090 and
go to Status → Targets. The prelude-collector target should be
UP, scraping http://host.docker.internal:9090/metrics/collector.
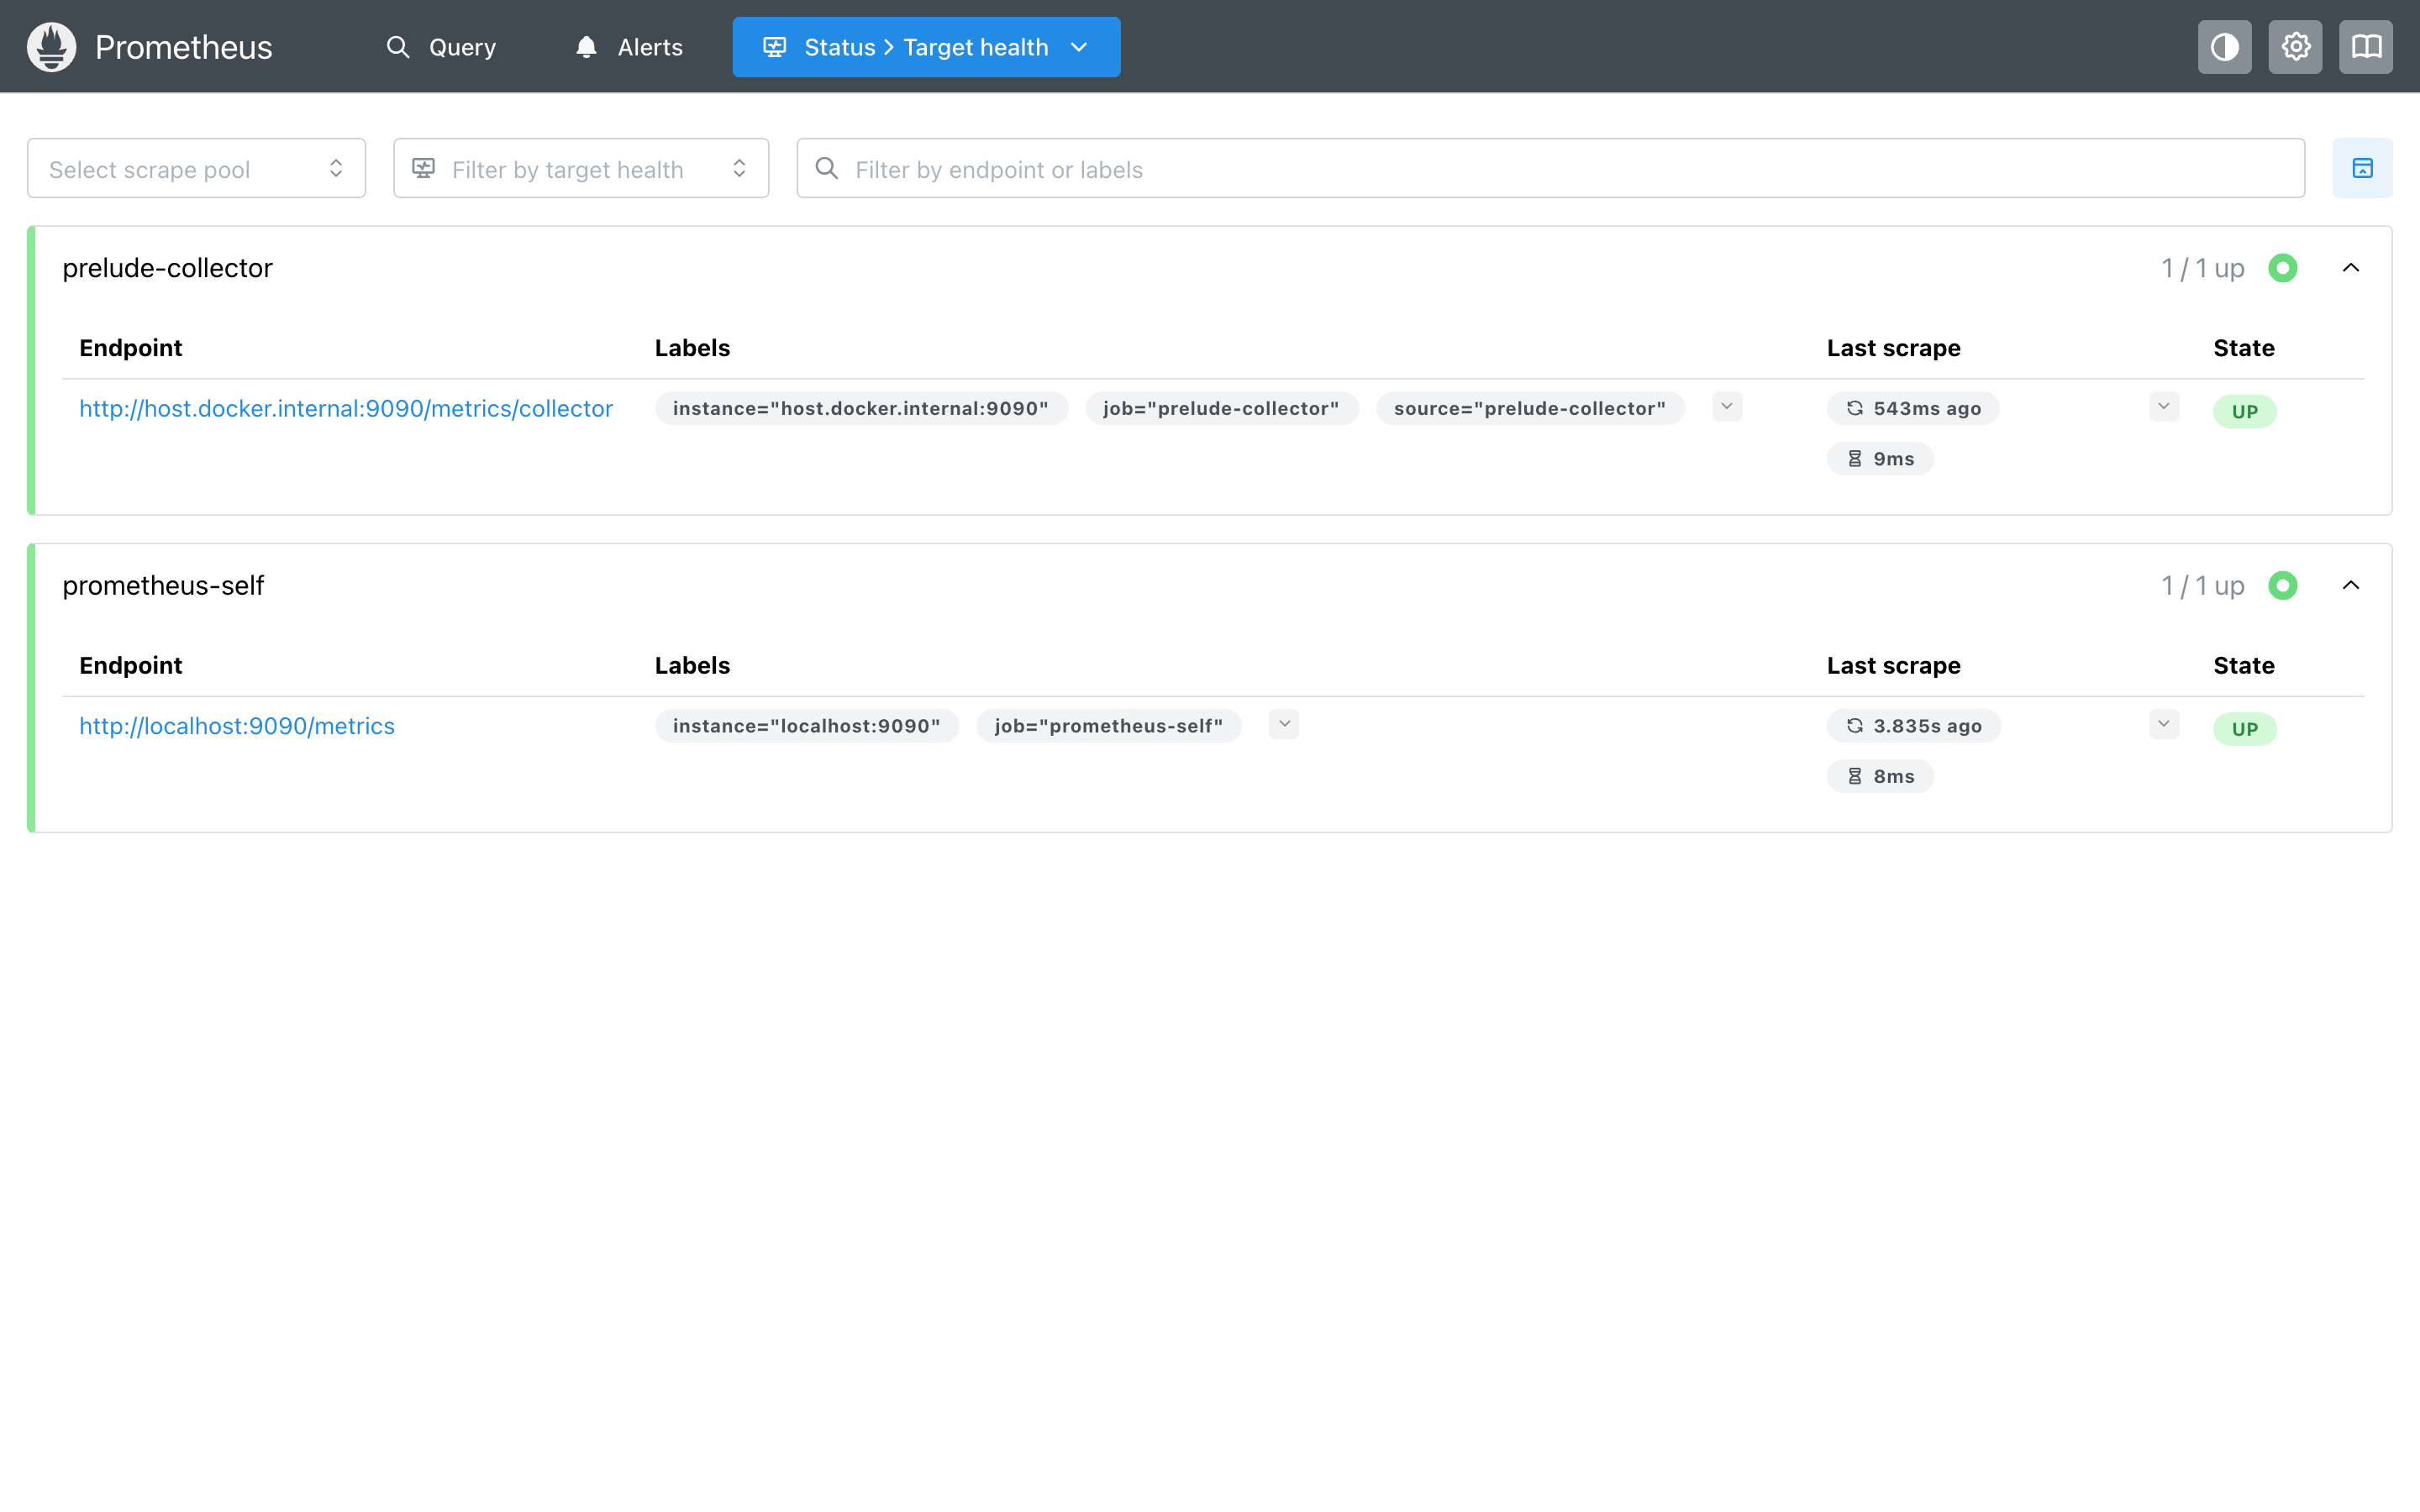
If it's DOWN, the cause is almost always networking or the output:
- Re-check that the Prometheus output is enabled (Step 2).
- Confirm the Prometheus container can reach the collector's port
9090(thehost.docker.internalnote in Step 1).
In the Prometheus expression bar, type
collector_interface_counters_in_octets_total and Execute — you
should see one series per interface per device. If a query returns
nothing, wait one scrape interval and one Subscription interval, then
retry.
Step 5 — Add the Prometheus data source in Grafana
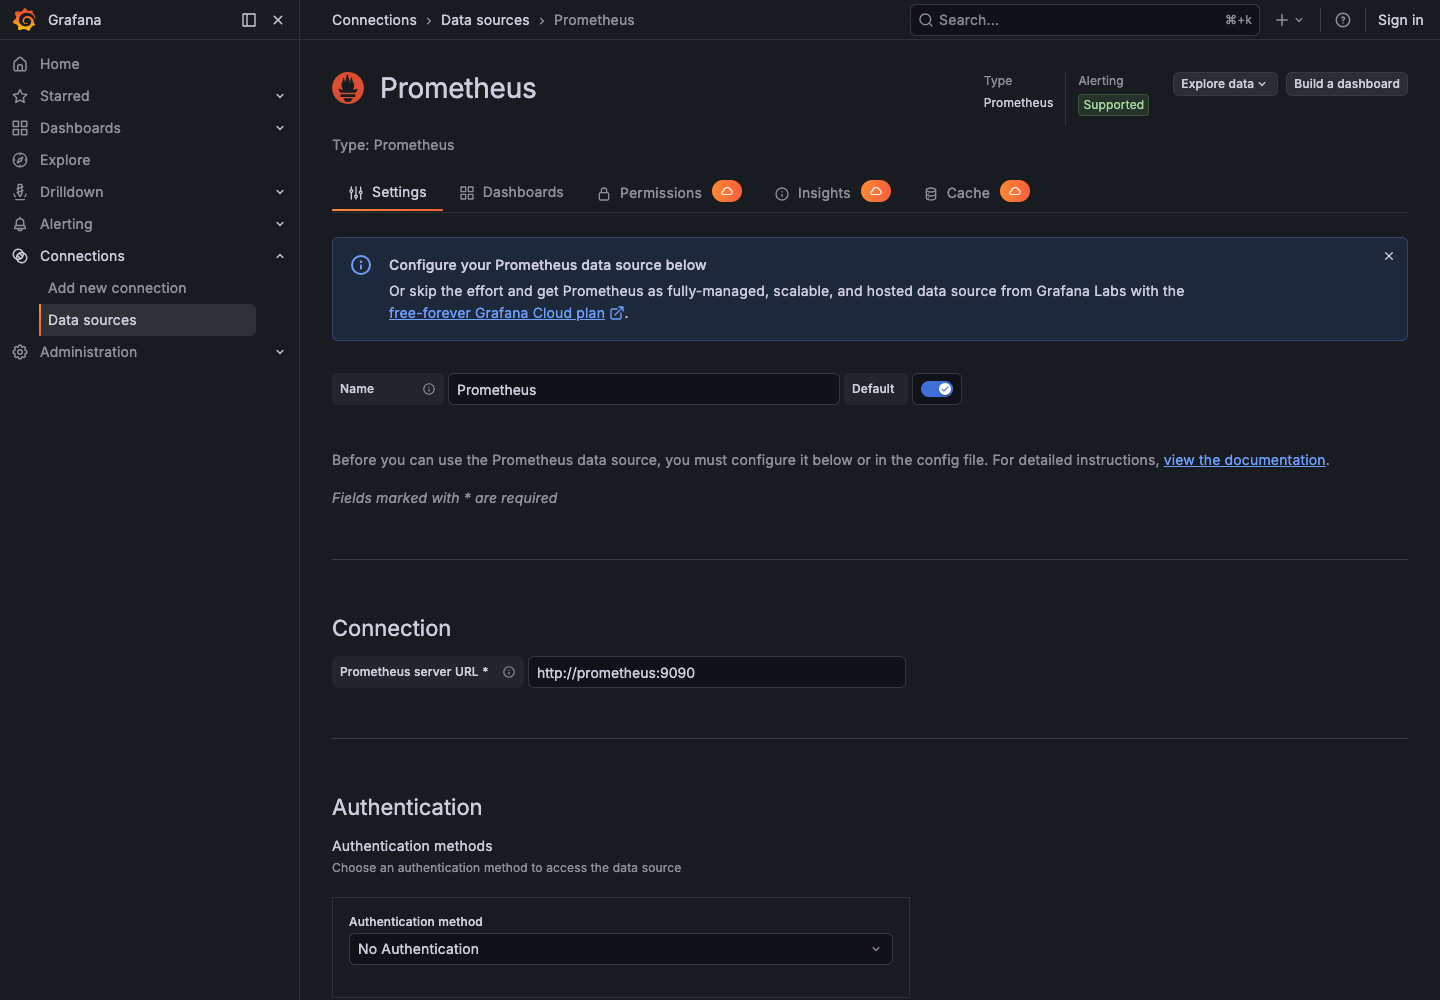
Back in Grafana: Connections → Data sources → Add data source → Prometheus.
- Prometheus server URL:
http://prometheus:9090(prometheusis the compose service name; Grafana resolves it on the same network). - Leave Authentication as No Authentication.
- Click Save & test — you should see "Successfully queried the Prometheus API".
Step 6 — Import the dashboard
Download the ready-made dashboard and import it:
Download interface-counters-grafana.json
In Grafana: Dashboards → New → Import, upload the file, and pick the
Prometheus data source from Step 5 when prompted. You get four panels —
inbound and outbound traffic per interface, an all-vendor status table,
and an error-rate panel — all keyed by device and interface, so both
vendors show up in the same panels.
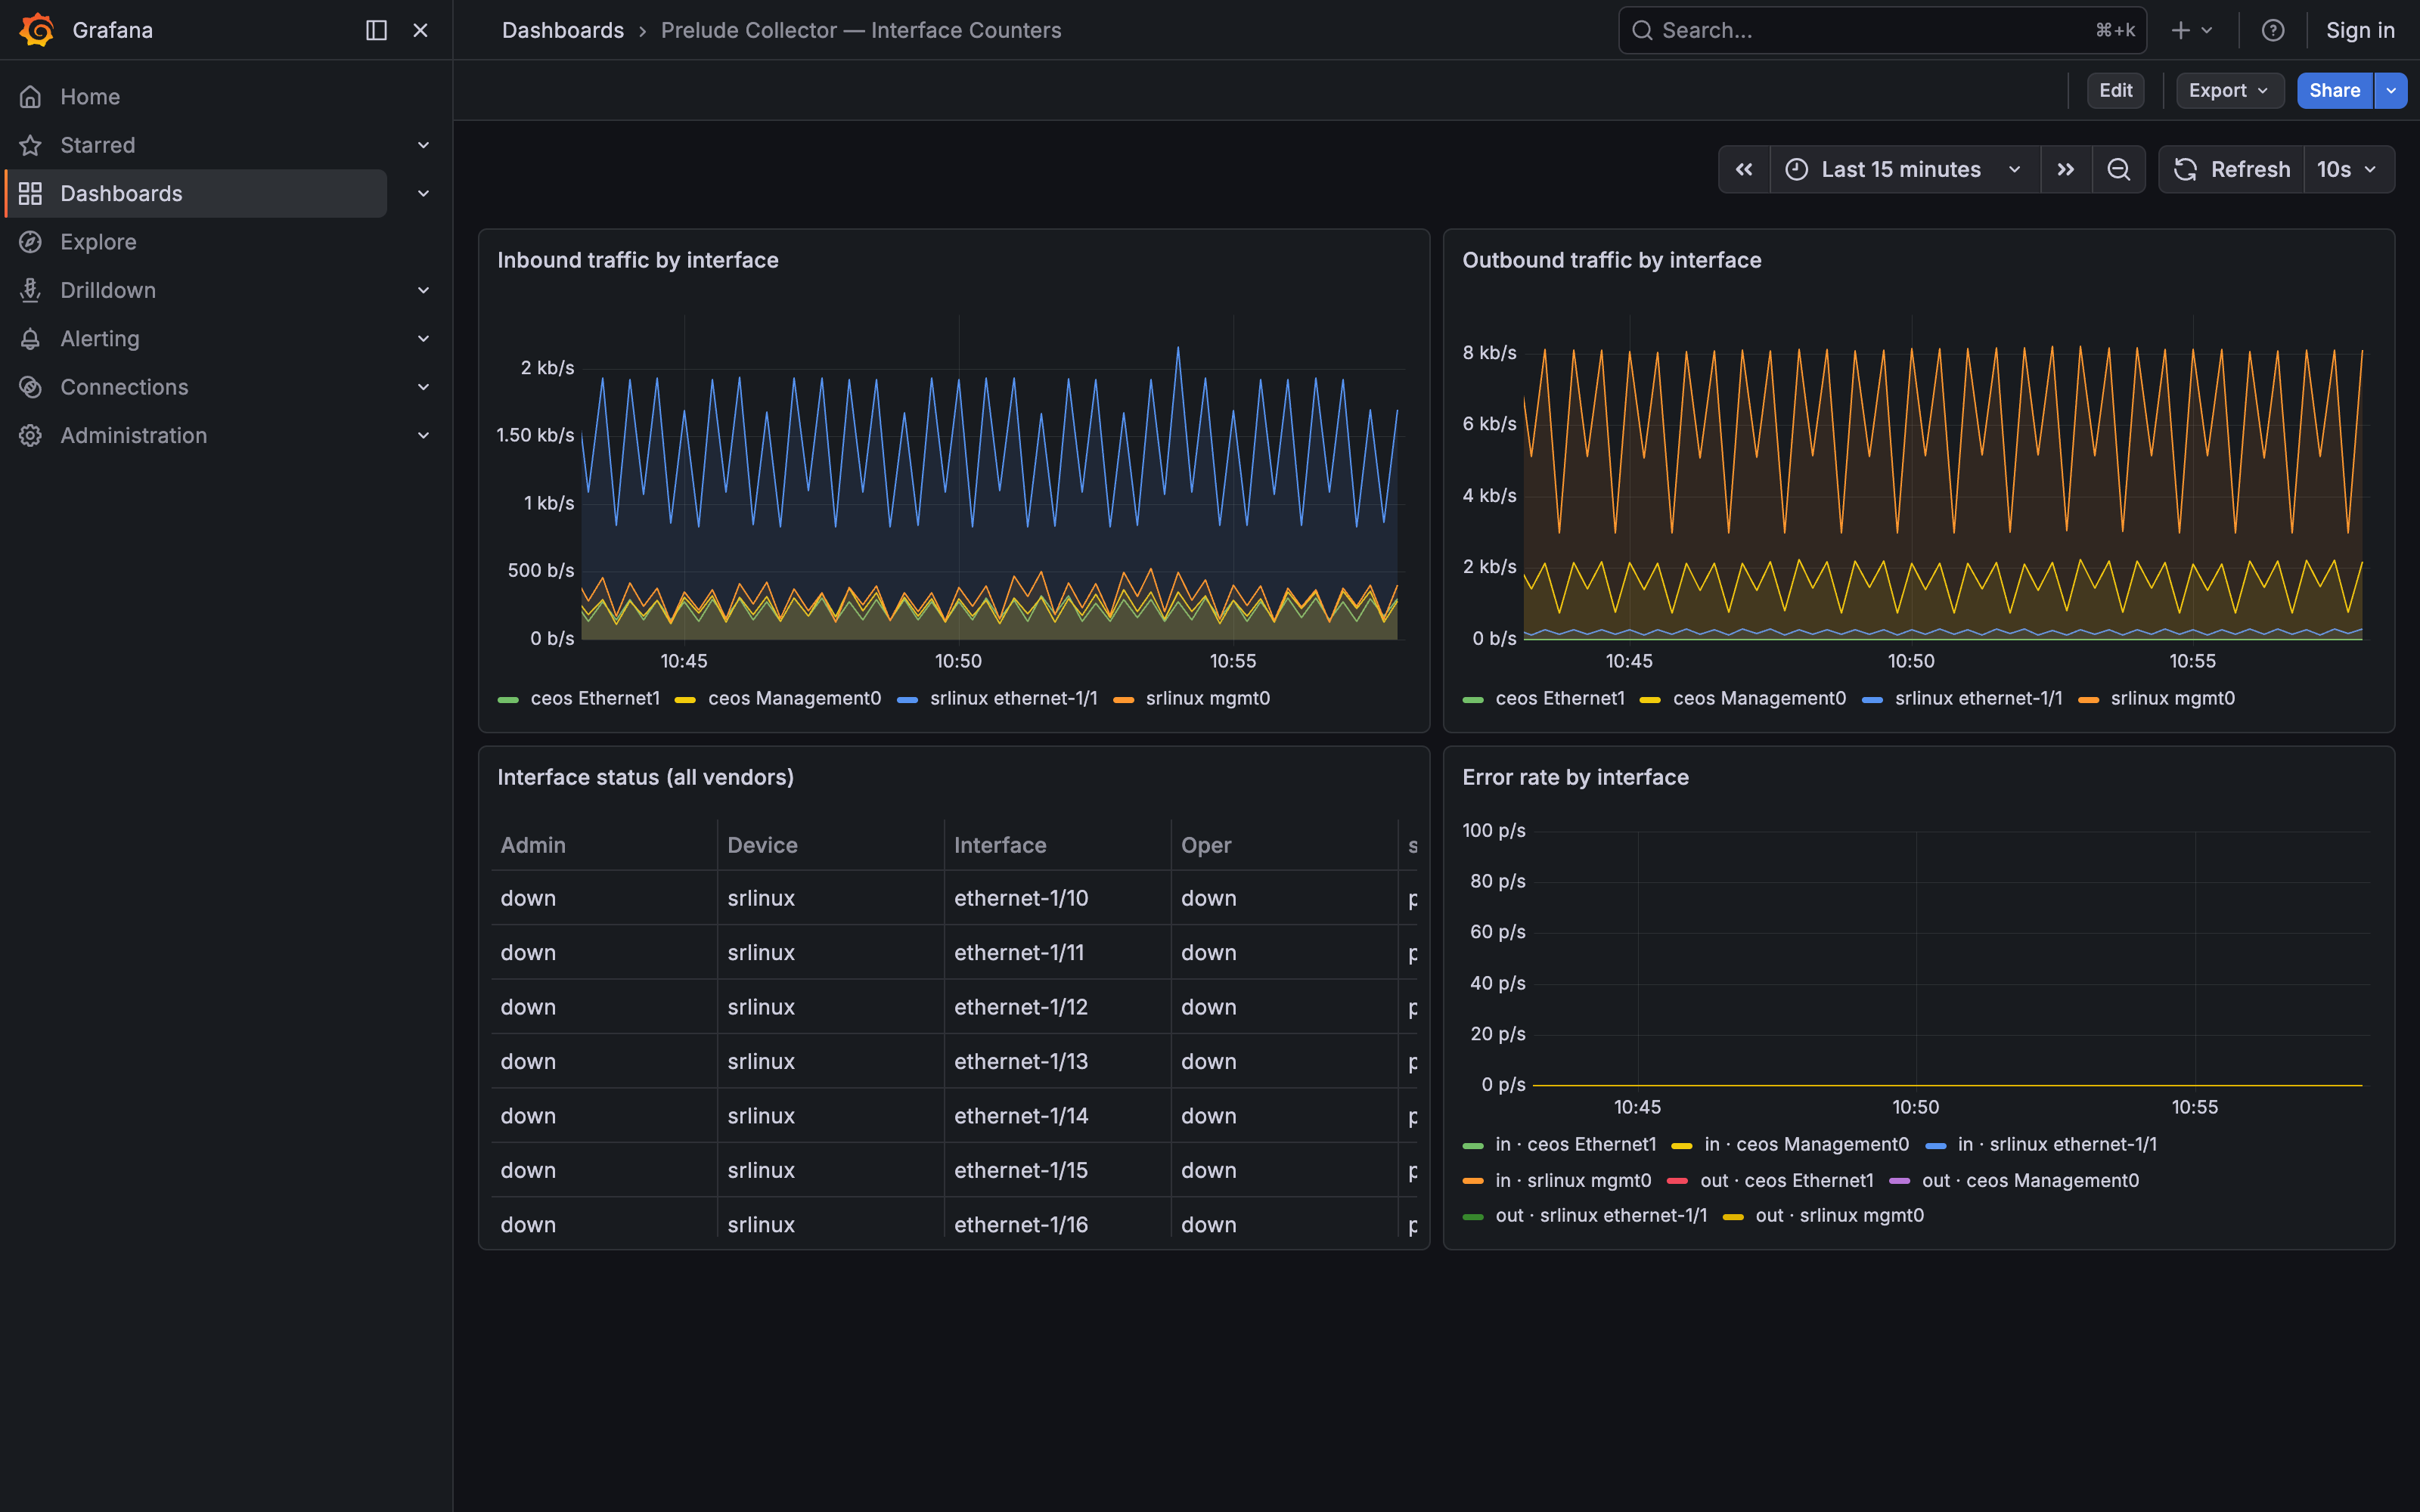
The panels are just PromQL over the metrics from Step 3 — adapt them freely:
# Inbound bits/sec per interface (×8 turns bytes into bits)
rate(collector_interface_counters_in_octets_total[$__rate_interval]) * 8

# Outbound bits/sec per interface
rate(collector_interface_counters_out_octets_total[$__rate_interval]) * 8

# Error rate per interface
rate(collector_interface_counters_in_errors_total[$__rate_interval])

# Current admin/oper status of every interface (table, instant)
collector_interface_counters_info
Set the traffic panels' unit to bits/sec (SI) and the legend to
{{device}} {{key}}. The device label distinguishes vendors
automatically; one panel covers them all.
Verify it works
You have a working pipeline when:
- [ ] The Prometheus output shows Enabled on the Outputs page.
- [ ] Prometheus Status → Targets lists
prelude-collectoras UP. - [ ]
collector_interface_counters_in_octets_totalreturns one series per interface in the Prometheus expression browser. - [ ] The Grafana panels update as traffic changes (or stay flat at the right magnitude on idle interfaces).
- [ ] Stopping a Subscription on the collector makes its series go stale within a scrape interval or two.
Troubleshooting
Target is DOWN. Prometheus can't reach the collector's metrics
endpoint. Confirm the output is enabled (Step 2) and that
host.docker.internal:9090 (or your equivalent) is reachable from the
Prometheus container.
A field is missing from Prometheus. Non-numeric fields are
dropped unless you give them a role. Set admin-status /
oper-status to info on the Output Hints tab (Step 3).
rate() looks wrong / negative. The field is exposed as a gauge,
not a counter. Set its role to counter (Step 3) — the metric name
gains a _total suffix and rate() handles resets correctly.
Values stuck at zero. That's real — the interface is idle on those counters. Pick a busier interface or generate traffic.
Panels are empty after import. The dashboard's data source didn't bind. Re-open the panel, confirm the Prometheus data source from Step 5 is selected, and that the metric names match what Step 3 exposes.
Where to next
- Interface counters across vendors — the normalized Model behind these panels; one Model, every vendor.
- Custom Starlark transform — reshape fields (units, derived values) before they reach the output.
- Concepts: Data flow — the order in which Protocol, Mapping, Transform, and output stages run.