
Interface counters across vendors
Import one normalized Model that collects interface counters from two different vendors and lands them under the same field names — done entirely in the web UI.
Multivendor networks normally mean multivendor data shapes. Arista
cEOS serves interface state as OpenConfig
(/interfaces/interface/state/counters/in-octets, status enums in
UPPERCASE). Nokia SR Linux doesn't serve that OpenConfig path at all —
it returns its native srl_nokia-interfaces model
(/interface/statistics/in-octets, status enums like enable /
disable). Same information, completely different paths, leaf names,
and value vocabulary.
Prelude Collector lets you define one normalized Model with vendor-neutral field names and attach a Mapping per vendor. The collector picks the right Mapping for each Device automatically and writes everything into the same shape under the same field names.
This tutorial does it all in the web UI — no API calls. You'll import a ready-made Model, attach two gNMI Devices from different vendors, compare the normalized output side by side, stream it, and read it back. Plan on 25–35 minutes.
What you'll learn
- Import a normalized, multivendor Model from a single JSON file.
- See how per-vendor Mappings translate two different data shapes
(OpenConfig and native
srl_nokia) into the same eight fields. - Use Compare Vendors to confirm both platforms land under identical field names, and to see exactly where they diverge.
- Start streaming Subscriptions on multiple Devices and read the normalized rows in the Data Explorer.
- Recognize where vendor differences show up (paths, leaf names, enum casing) and where the Mapping absorbs them.
Prerequisites
- Prelude Collector v1.1.0 running, and you signed in to the web UI. See Installation.
- Two gNMI-capable devices from different vendors. This walkthrough uses one Nokia SR Linux and one Arista cEOS node; the same flow works for any two gNMI platforms (Cisco IOS-XR, Juniper, …).
Spin up two vendors with containerlab
If you don't already have two vendors handy, containerlab gives you a Nokia SR Linux and an Arista cEOS node on your laptop in a couple of minutes. Both expose gNMI, which is all the collector needs.
- Nokia SR Linux runs from a public image — see containerlab.dev/manual/kinds/srl.
- Arista cEOS needs an image you download from
arista.com and import once with
docker import— see containerlab.dev/manual/kinds/ceos.
Drop this into multivendor.clab.yml:
name: multivendor
topology:
  nodes:
    srlinux:
      kind: nokia_srlinux
      image: ghcr.io/nokia/srlinux:latest
    ceos:
      kind: ceos
      image: ceos:4.35.3F          # the tag you imported
  links:
    - endpoints: ["srlinux:e1-1", "ceos:eth1"]
Then deploy it:
sudo containerlab deploy -t multivendor.clab.yml
containerlab enables gNMI on both nodes and prints each node's management address. The connection details you'll need when you add the Devices:
| Vendor | Network OS | gNMI port | TLS | Encoding |
|---|---|---|---|---|
| Nokia SR Linux | srlinux |
57400 |
Yes — self-signed, so skip cert verify | JSON_IETF |
| Arista cEOS | eos |
6030 |
No (plaintext) | JSON_IETF |
The default management credentials are documented on the kind pages linked above (SR Linux
admin/NokiaSrl1!; cEOSadmin/admin). Use whatever you set on your own nodes.
Step 1 — Add the two devices
In the UI, go to Devices → Add Device. Create one Device per node,
filling in the hostname, the node's management address, and its
Network OS (srlinux for the SR Linux node, eos for the cEOS node).
On the new Device's detail page, find gNMI under Protocol
Support and click Setup. Enter the port, credentials, and TLS
settings from the table above — for SR Linux tick Use TLS and
Skip cert verify; for cEOS leave TLS off. Set the encoding to
JSON_IETF for both.
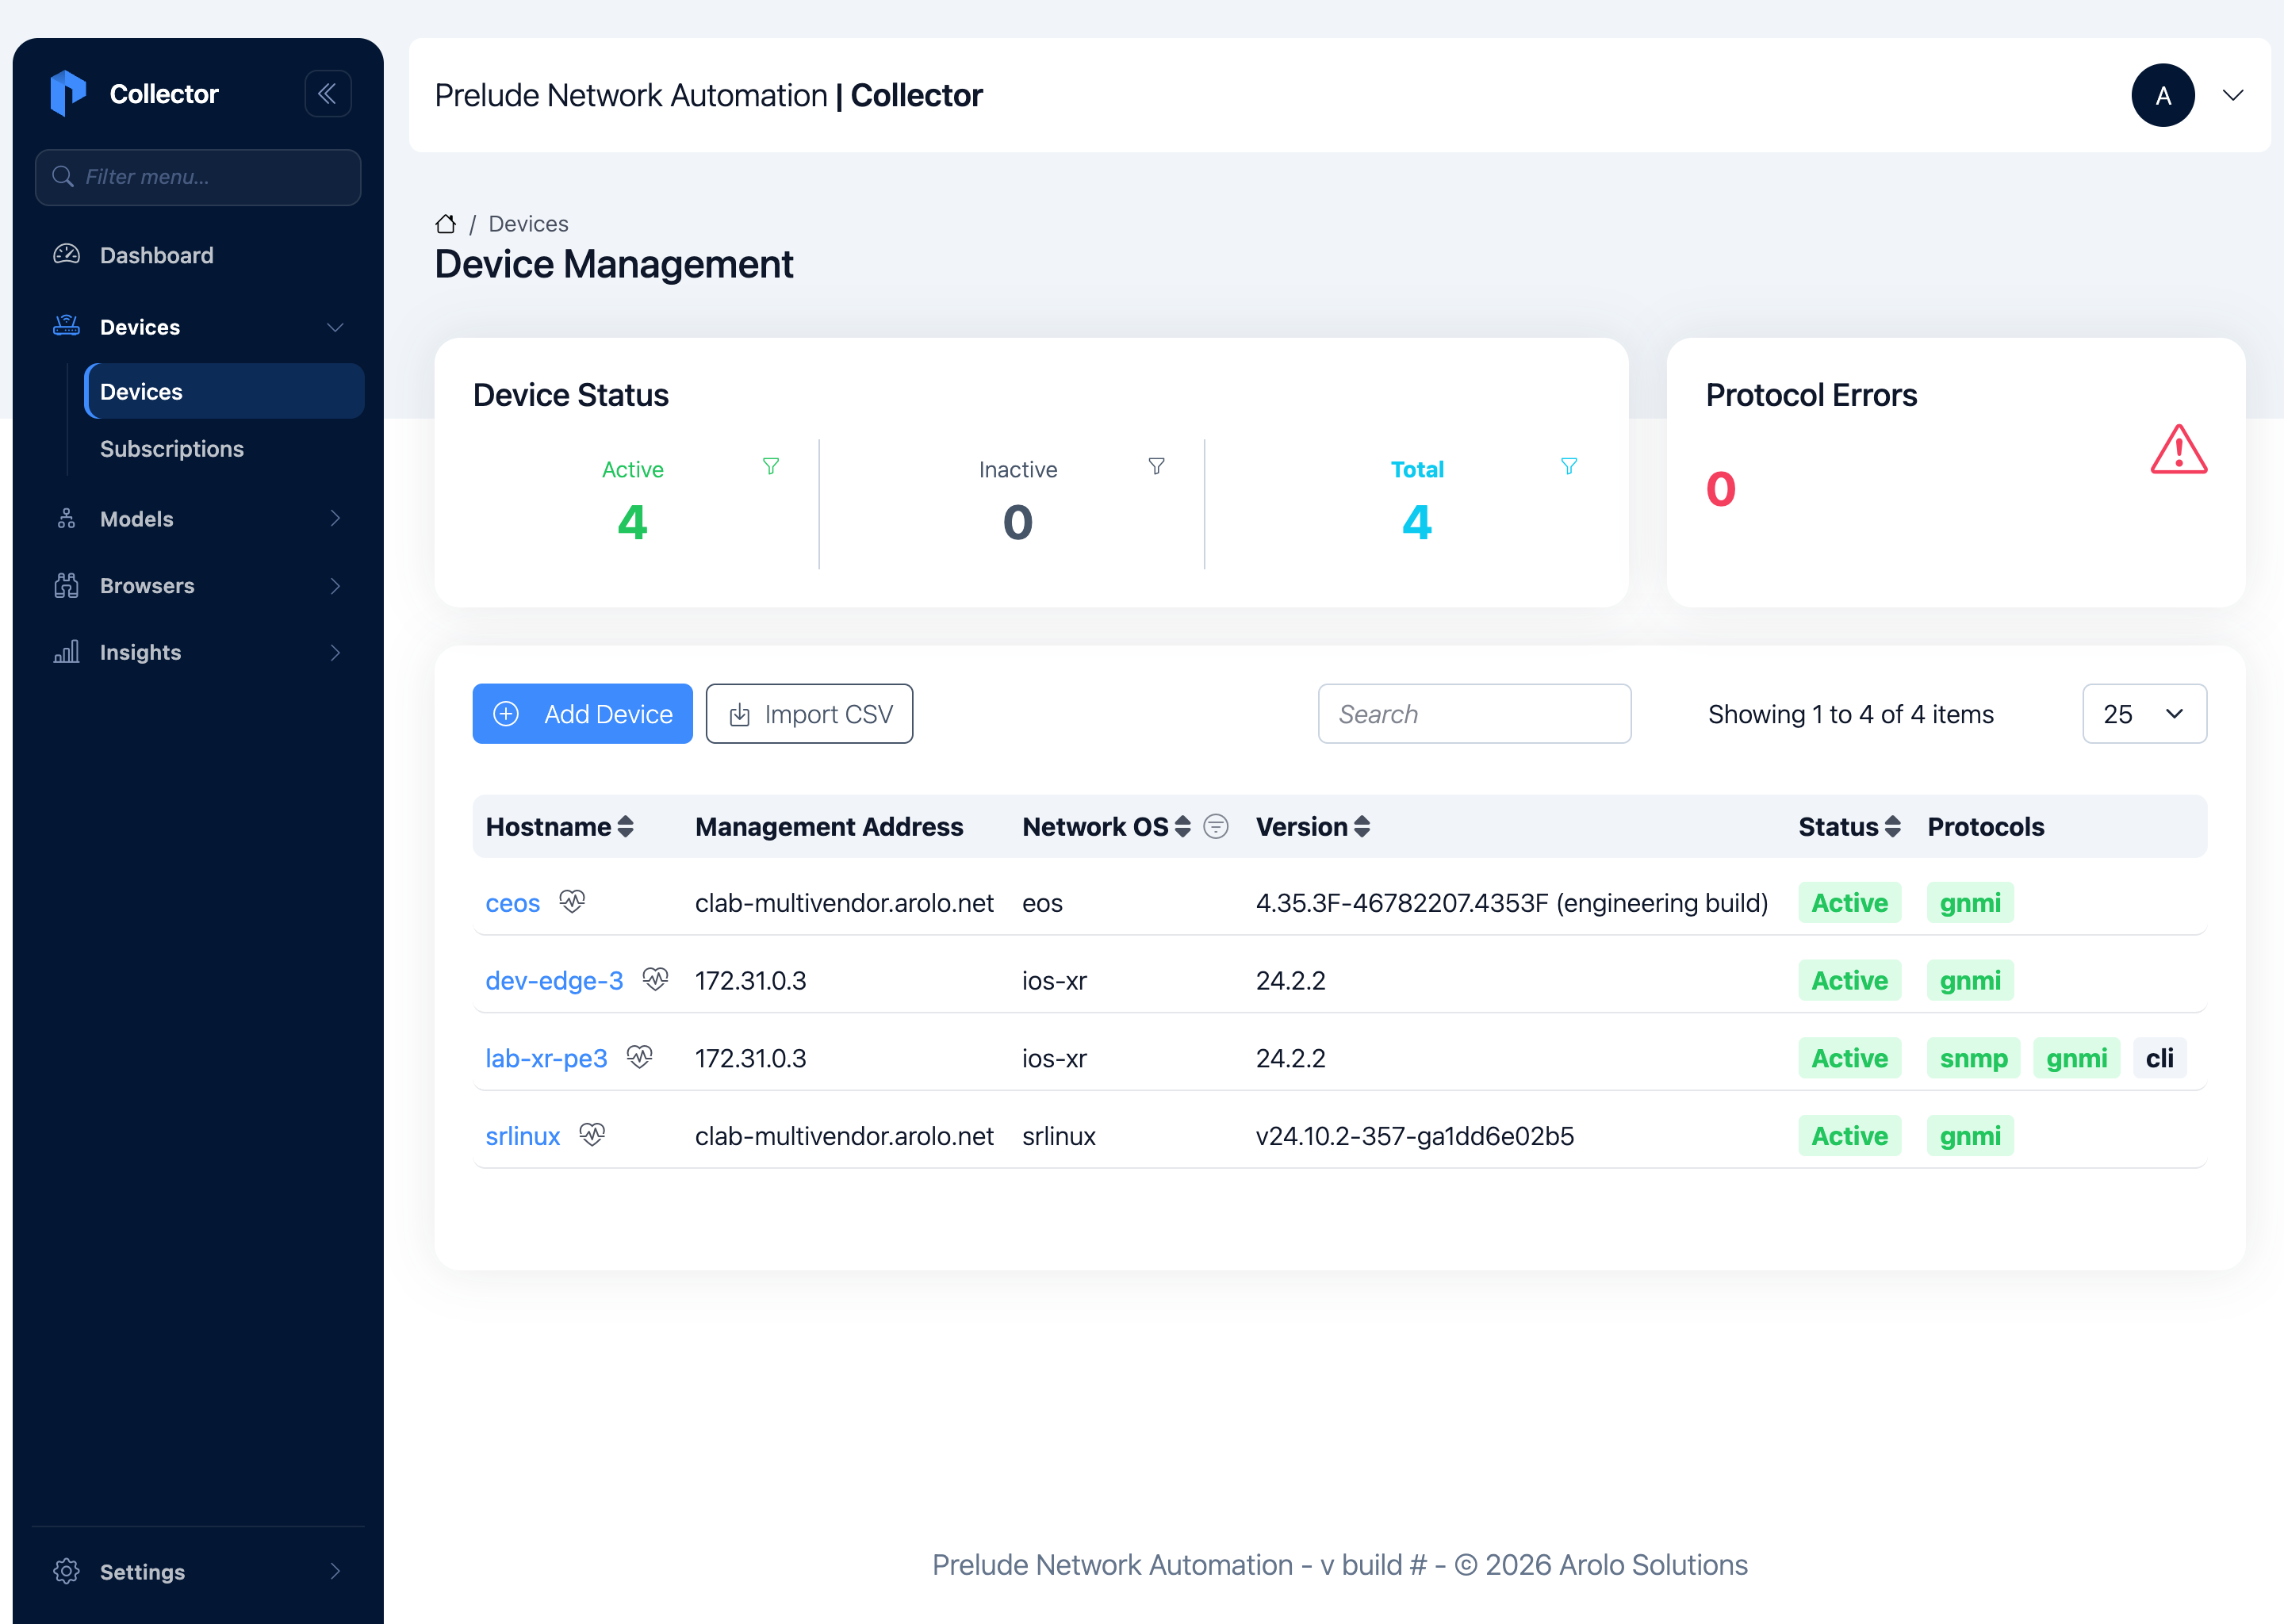
Once both Devices are added, the Devices list shows them Active with a gNMI protocol attached, and their software version auto-detected from the gNMI capabilities exchange.
Open a Device to confirm gNMI shows Connected.
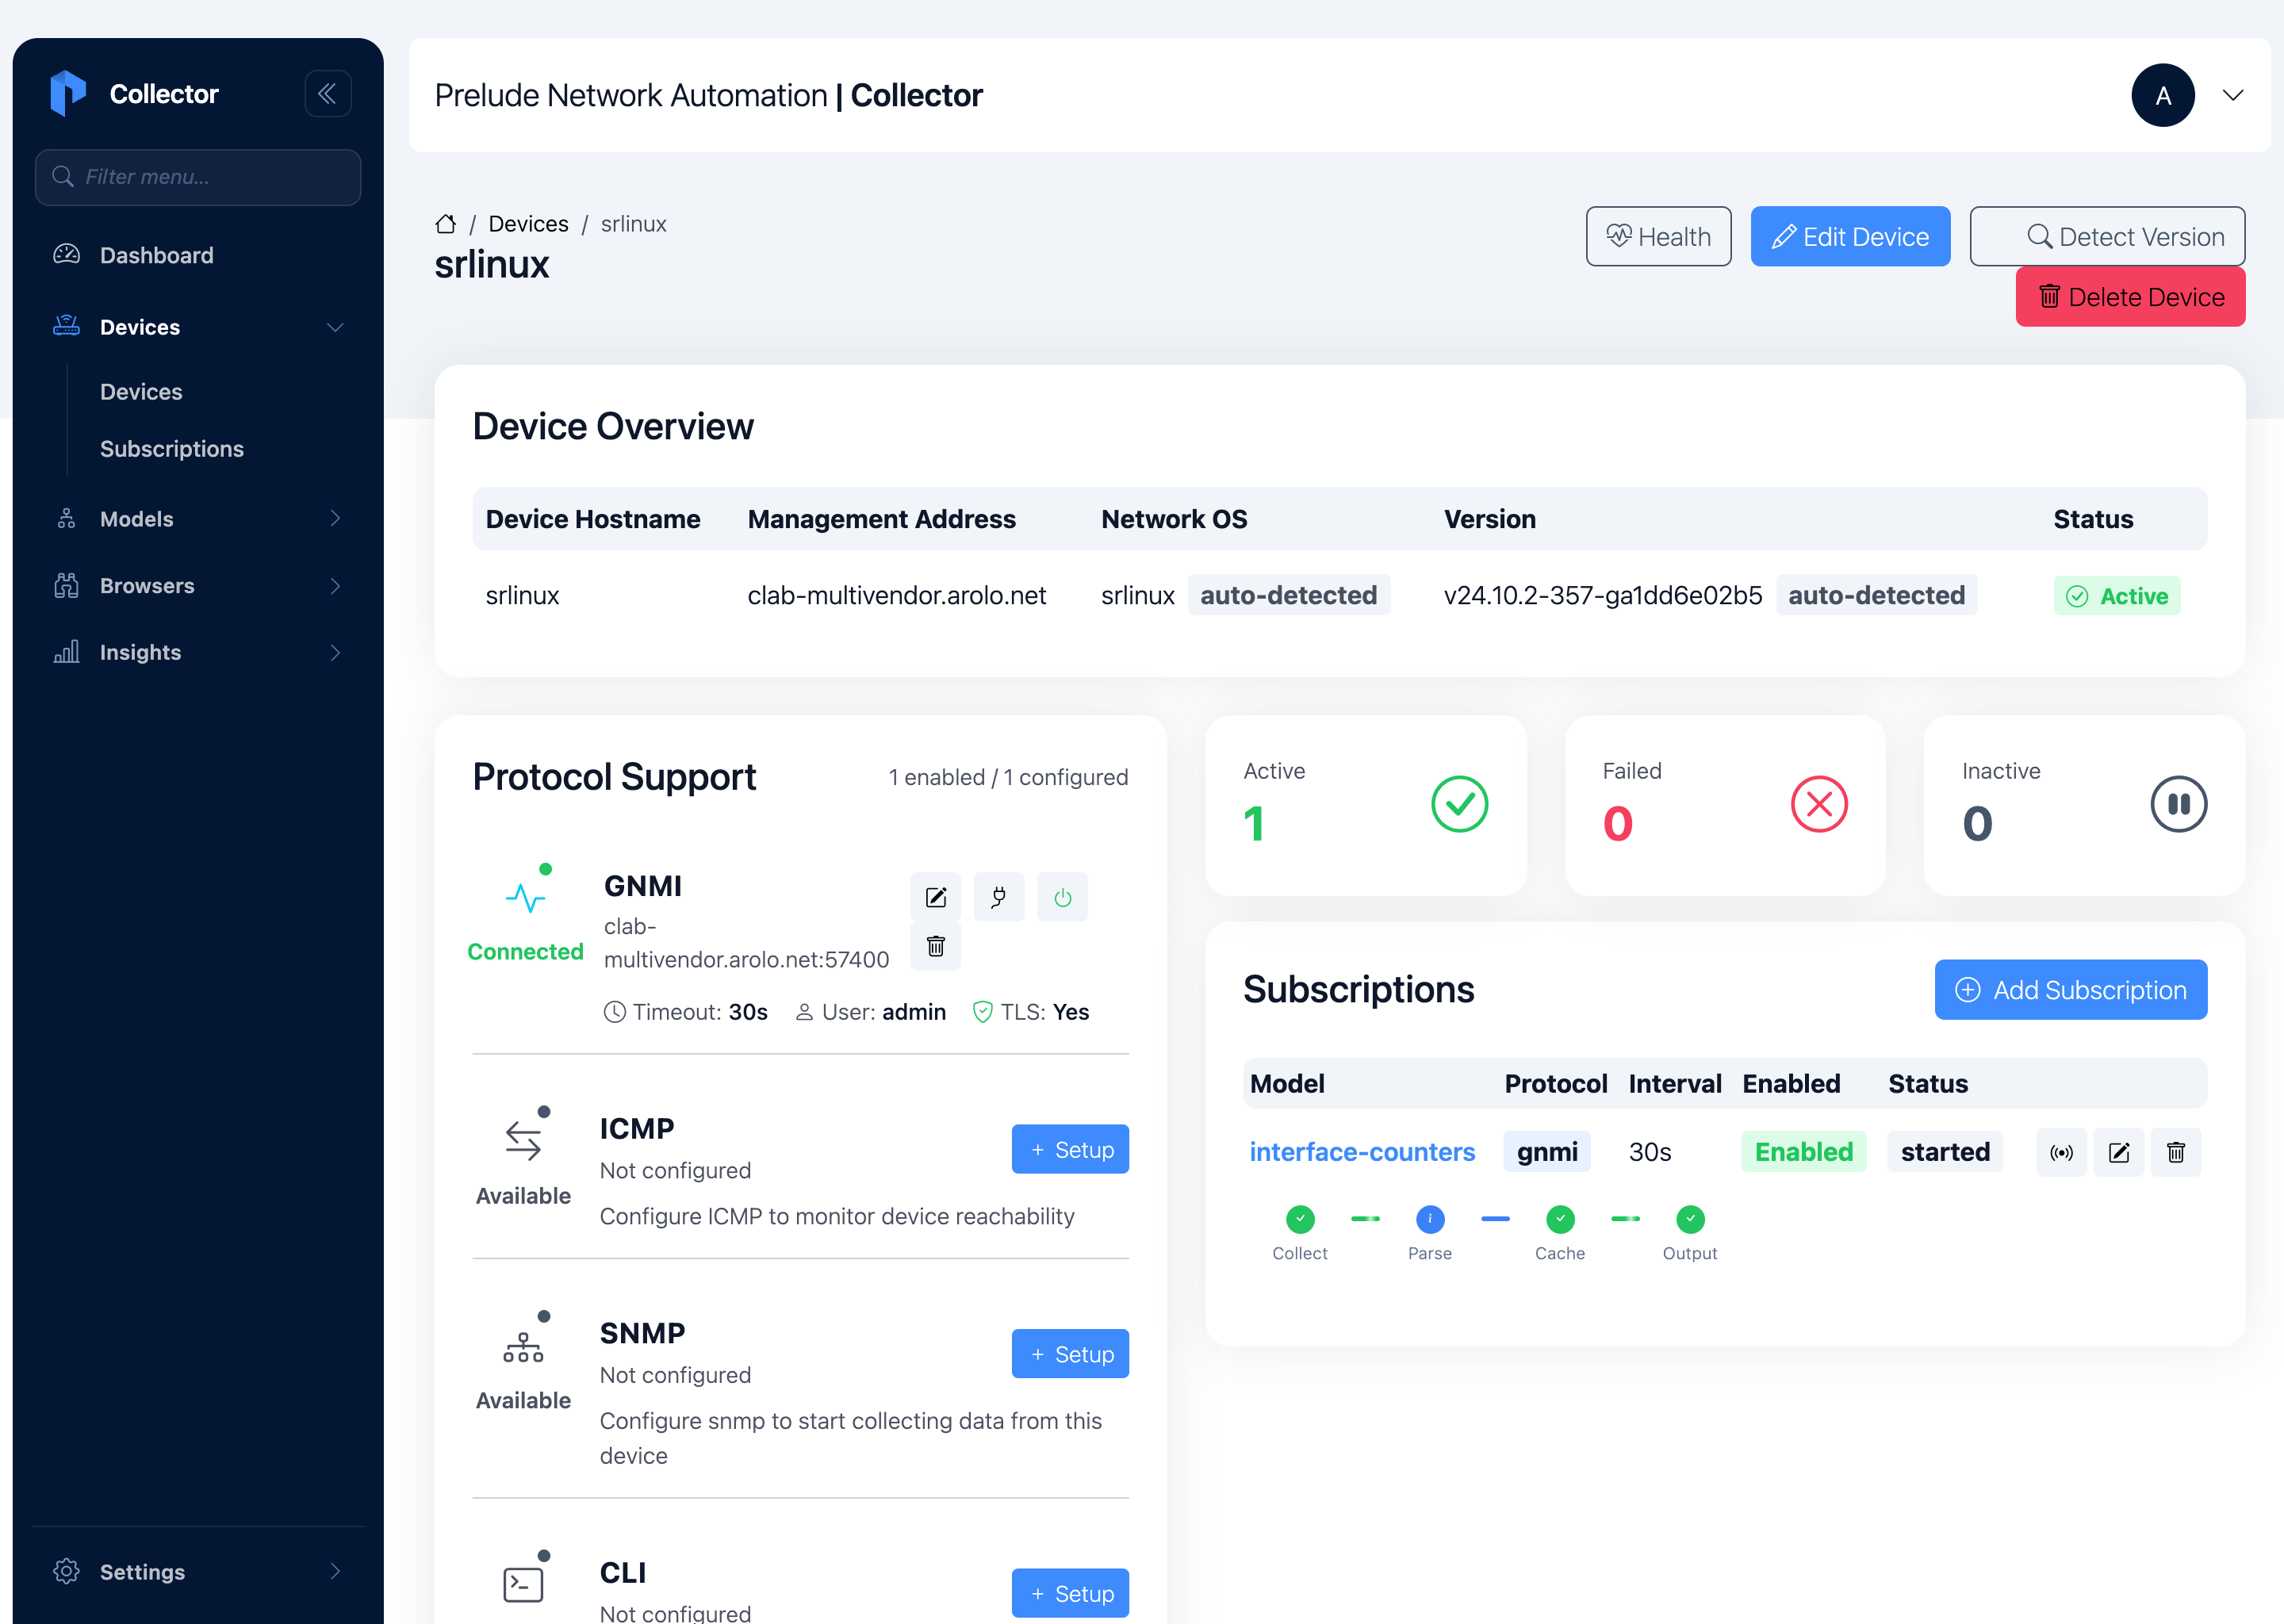
gNMI shows Connected only while a subscription is streaming. With no subscription yet, a freshly added Device can read disconnected even though it's reachable — that's expected. It turns green in Step 4.
Step 2 — Import the interface-counters model
Instead of building the Model field by field, import it from one file.
Download interface-counters.json
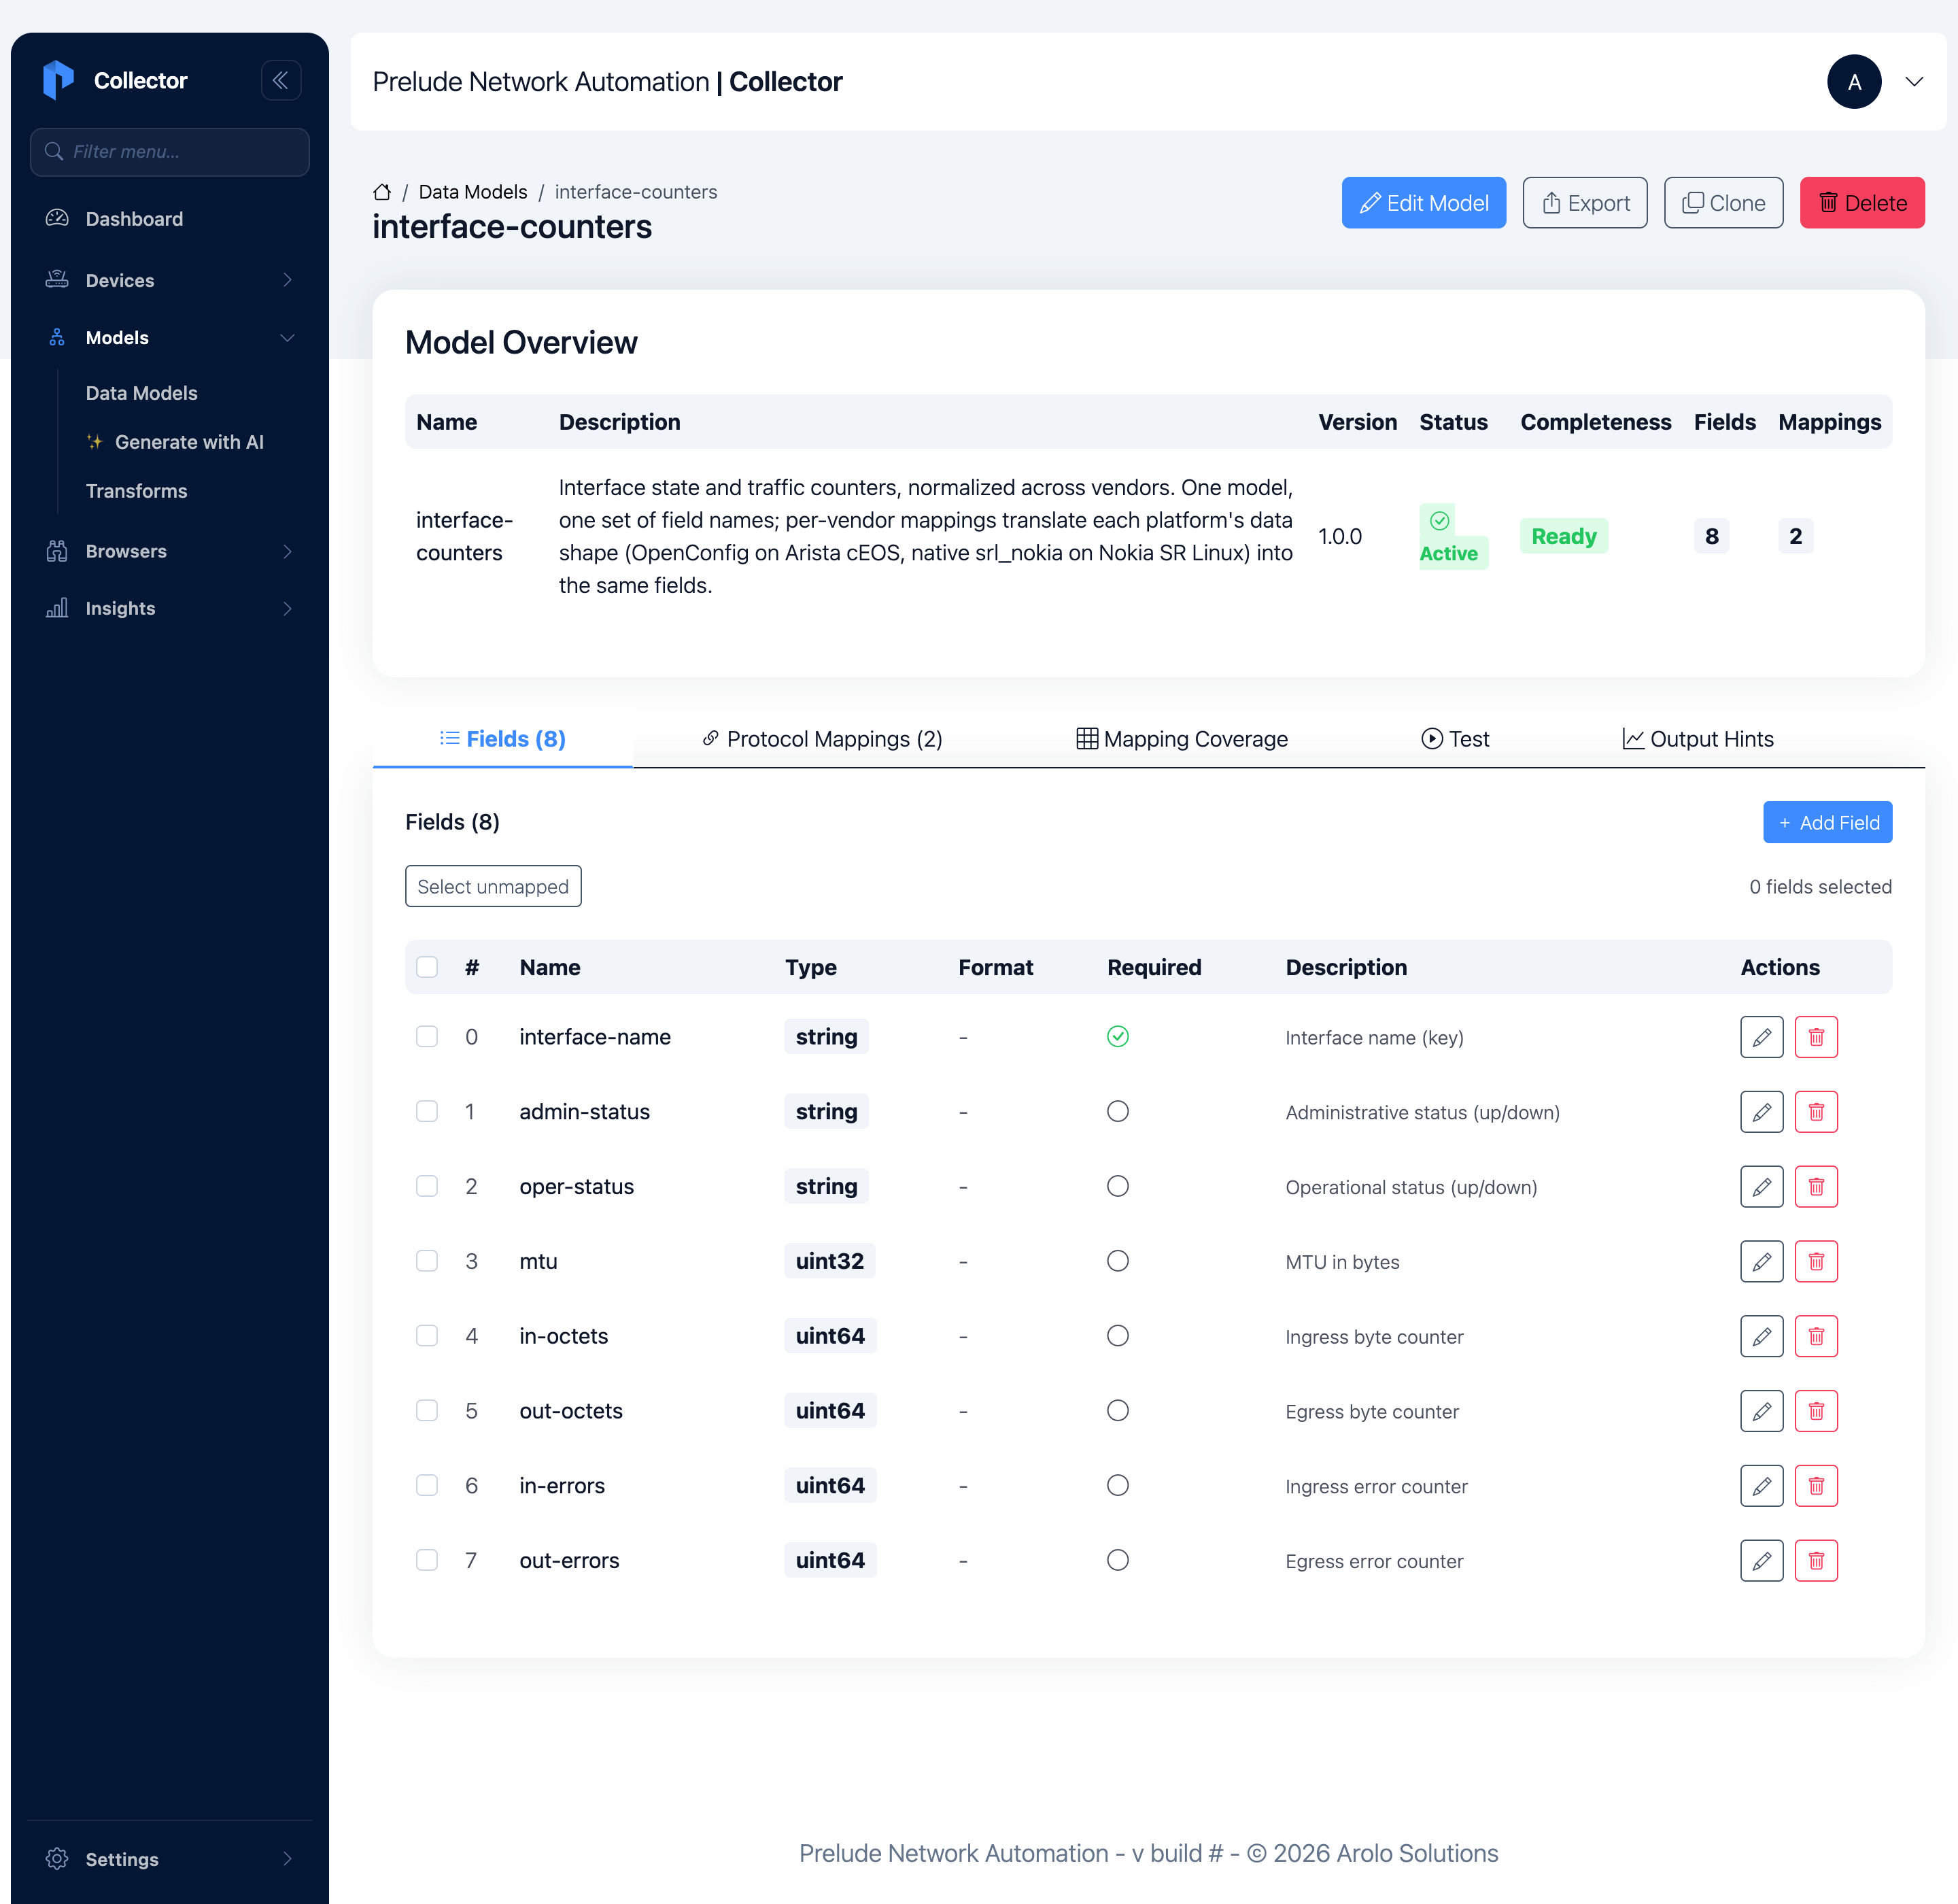
It defines eight normalized fields — interface-name (the key),
admin-status, oper-status, mtu, and ingress/egress octet and
error counters — plus two gNMI Mappings, one per vendor:
{
  "name": "interface-counters",
  "description": "Interface state and traffic counters, normalized across vendors. One model, one set of field names; per-vendor mappings translate each platform's data shape (OpenConfig on Arista cEOS, native srl_nokia on Nokia SR Linux) into the same fields.",
  "version": "1.0.0",
  "fields": [
    {"name": "interface-name", "field-type": "string", "required": true,  "description": "Interface name (key)",            "position": 0},
    {"name": "admin-status",   "field-type": "string", "required": false, "description": "Administrative status (up/down)", "position": 1},
    {"name": "oper-status",    "field-type": "string", "required": false, "description": "Operational status (up/down)",    "position": 2},
    {"name": "mtu",            "field-type": "uint32", "required": false, "description": "MTU in bytes",                     "position": 3},
    {"name": "in-octets",      "field-type": "uint64", "required": false, "description": "Ingress byte counter",            "position": 4},
    {"name": "out-octets",     "field-type": "uint64", "required": false, "description": "Egress byte counter",             "position": 5},
    {"name": "in-errors",      "field-type": "uint64", "required": false, "description": "Ingress error counter",           "position": 6},
    {"name": "out-errors",     "field-type": "uint64", "required": false, "description": "Egress error counter",            "position": 7}
  ],
  "mappings": [
    {
      "protocol": "gnmi",
      "netos": "srlinux",
      "key-field": "name",
      "gnmi-paths": [
        "/interface/admin-state",
        "/interface/oper-state",
        "/interface/mtu",
        "/interface/statistics"
      ],
      "field-mappings": {
        "name":              "interface-name",
        "admin-state":       "admin-status",
        "oper-state":        "oper-status",
        "mtu":               "mtu",
        "in-octets":         "in-octets",
        "out-octets":        "out-octets",
        "in-error-packets":  "in-errors",
        "out-error-packets": "out-errors"
      },
      "value-transforms": {
        "admin-status": {"enable": "up", "disable": "down"},
        "oper-status":  {"up": "up", "down": "down"}
      }
    },
    {
      "protocol": "gnmi",
      "netos": "eos",
      "key-field": "name",
      "gnmi-paths": ["/interfaces/interface/state"],
      "field-mappings": {
        "name":         "interface-name",
        "admin-status": "admin-status",
        "oper-status":  "oper-status",
        "mtu":          "mtu",
        "in-octets":    "in-octets",
        "out-octets":   "out-octets",
        "in-errors":    "in-errors",
        "out-errors":   "out-errors"
      },
      "field-transforms": {
        "admin-status": ["lowercase"],
        "oper-status":  ["lowercase"]
      }
    }
  ]
}
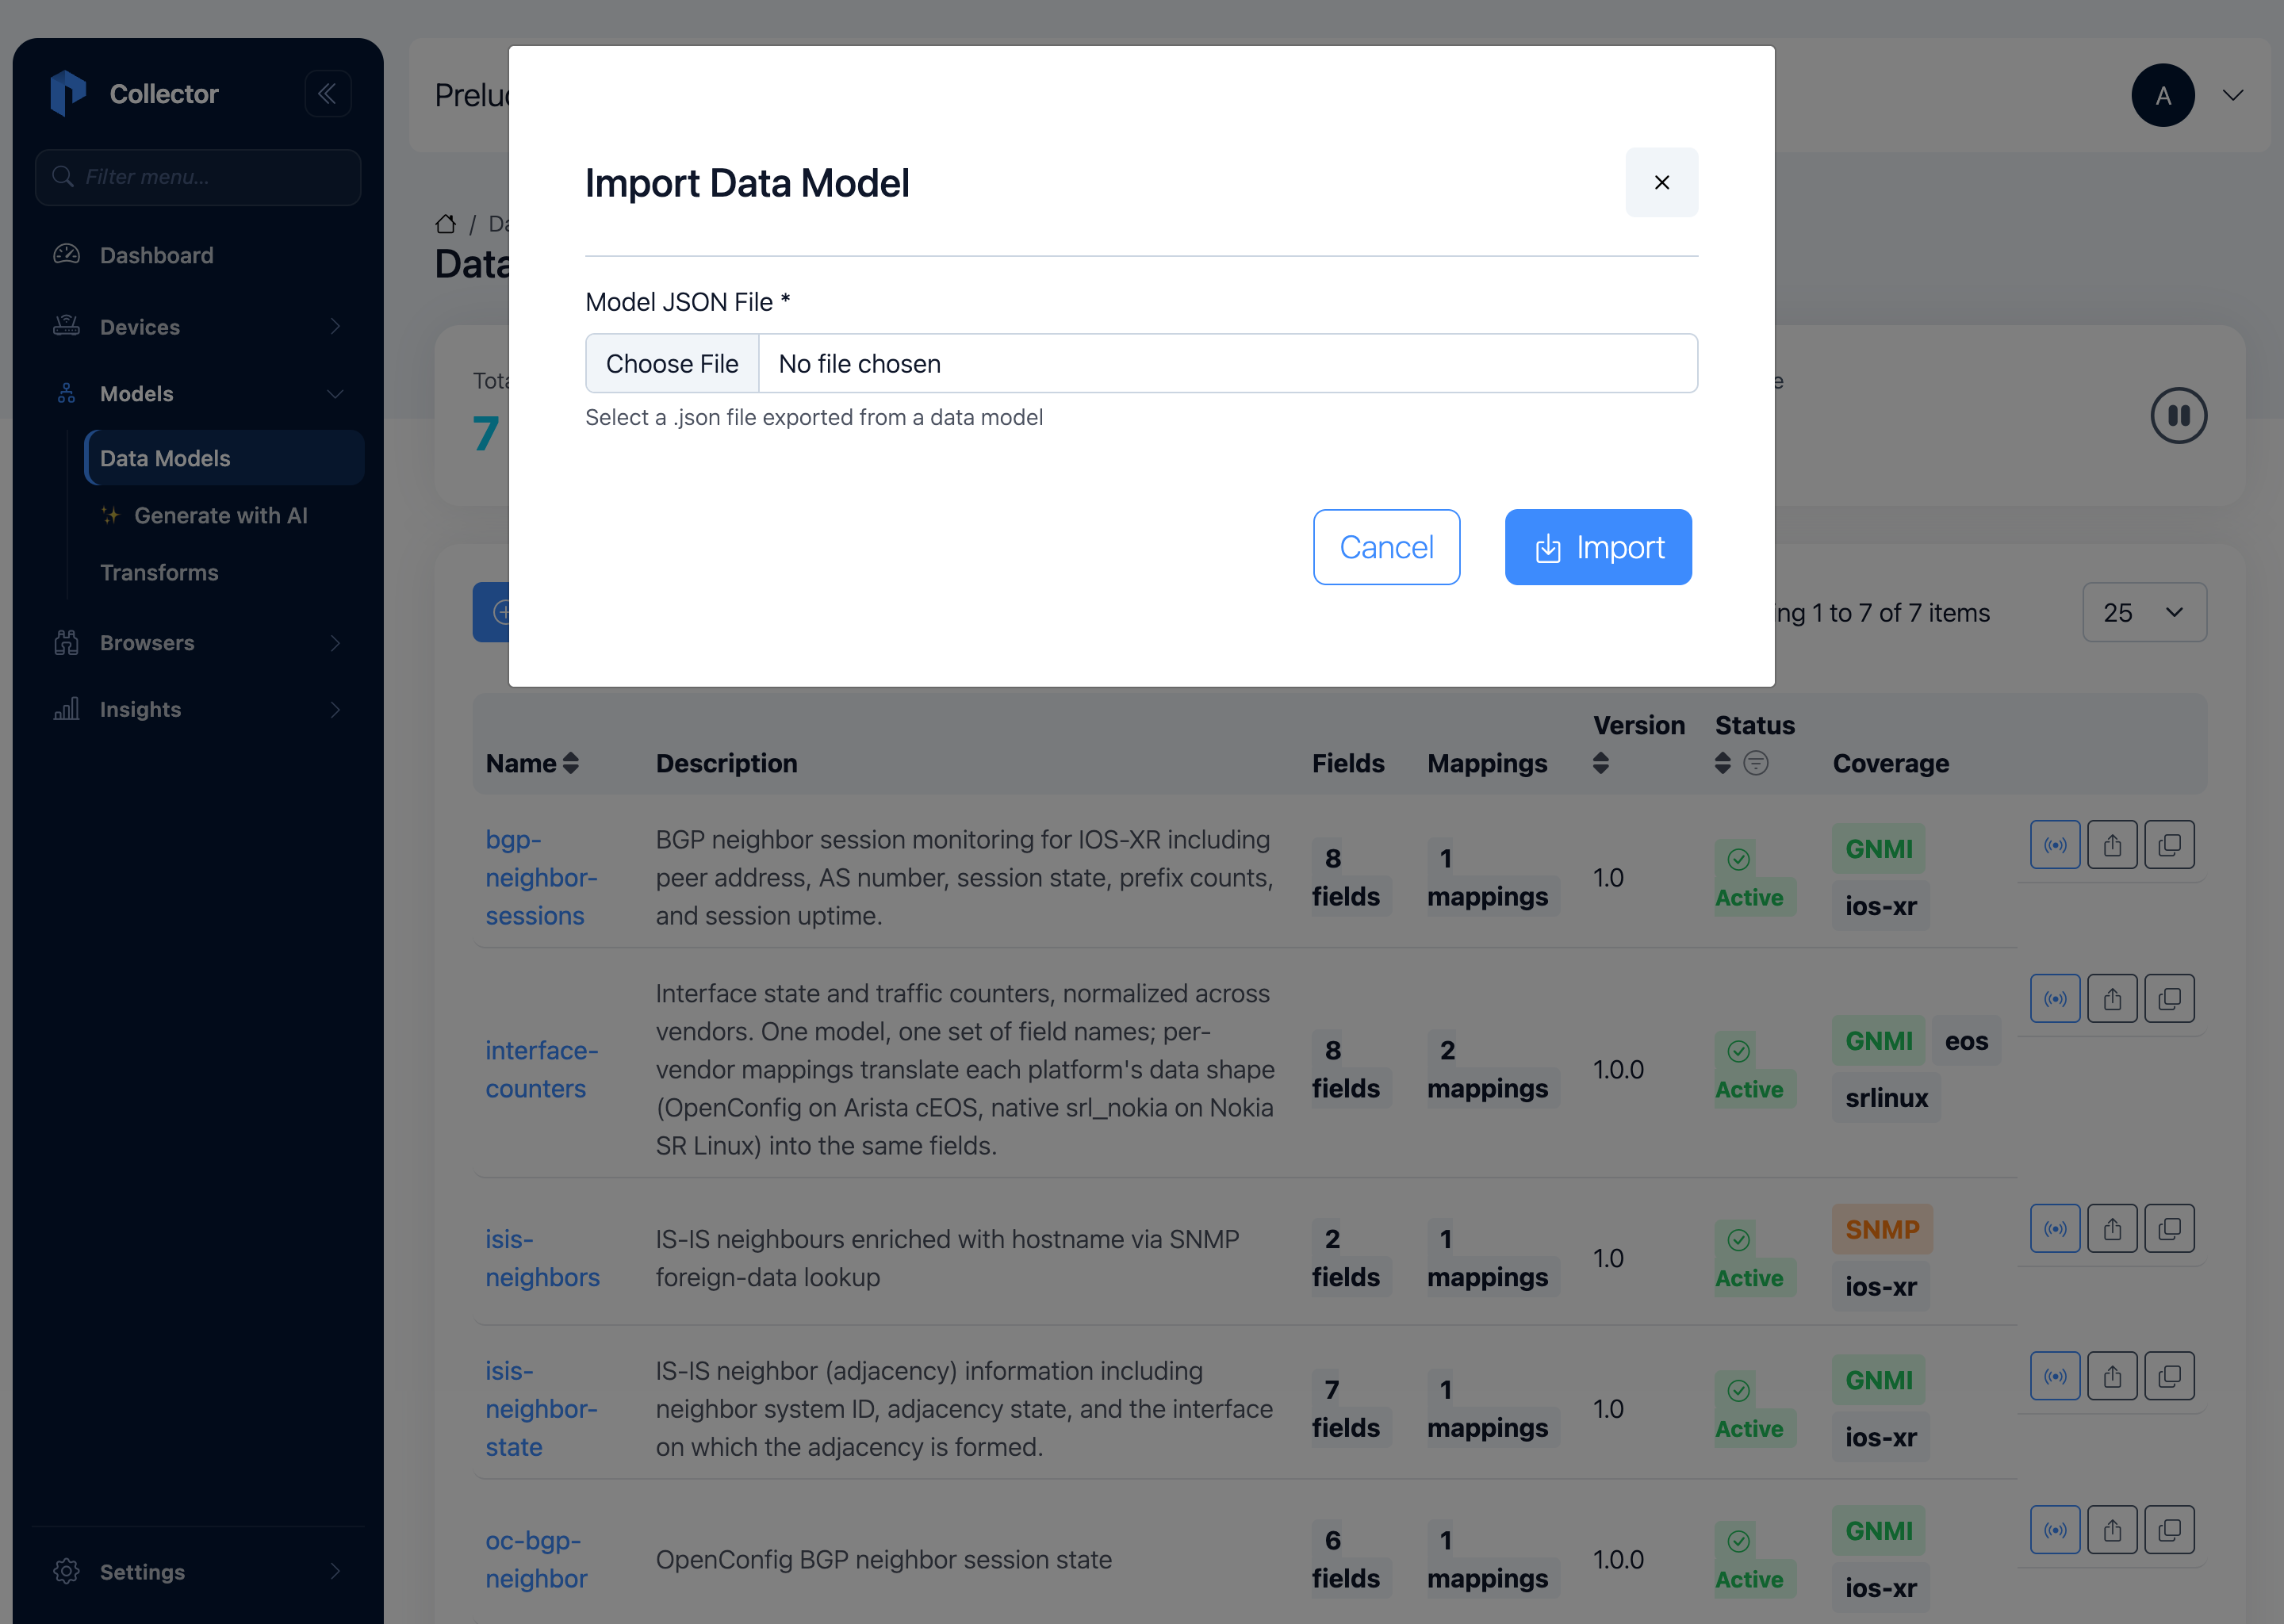
Go to Models, click Import, choose the file, and click Import.
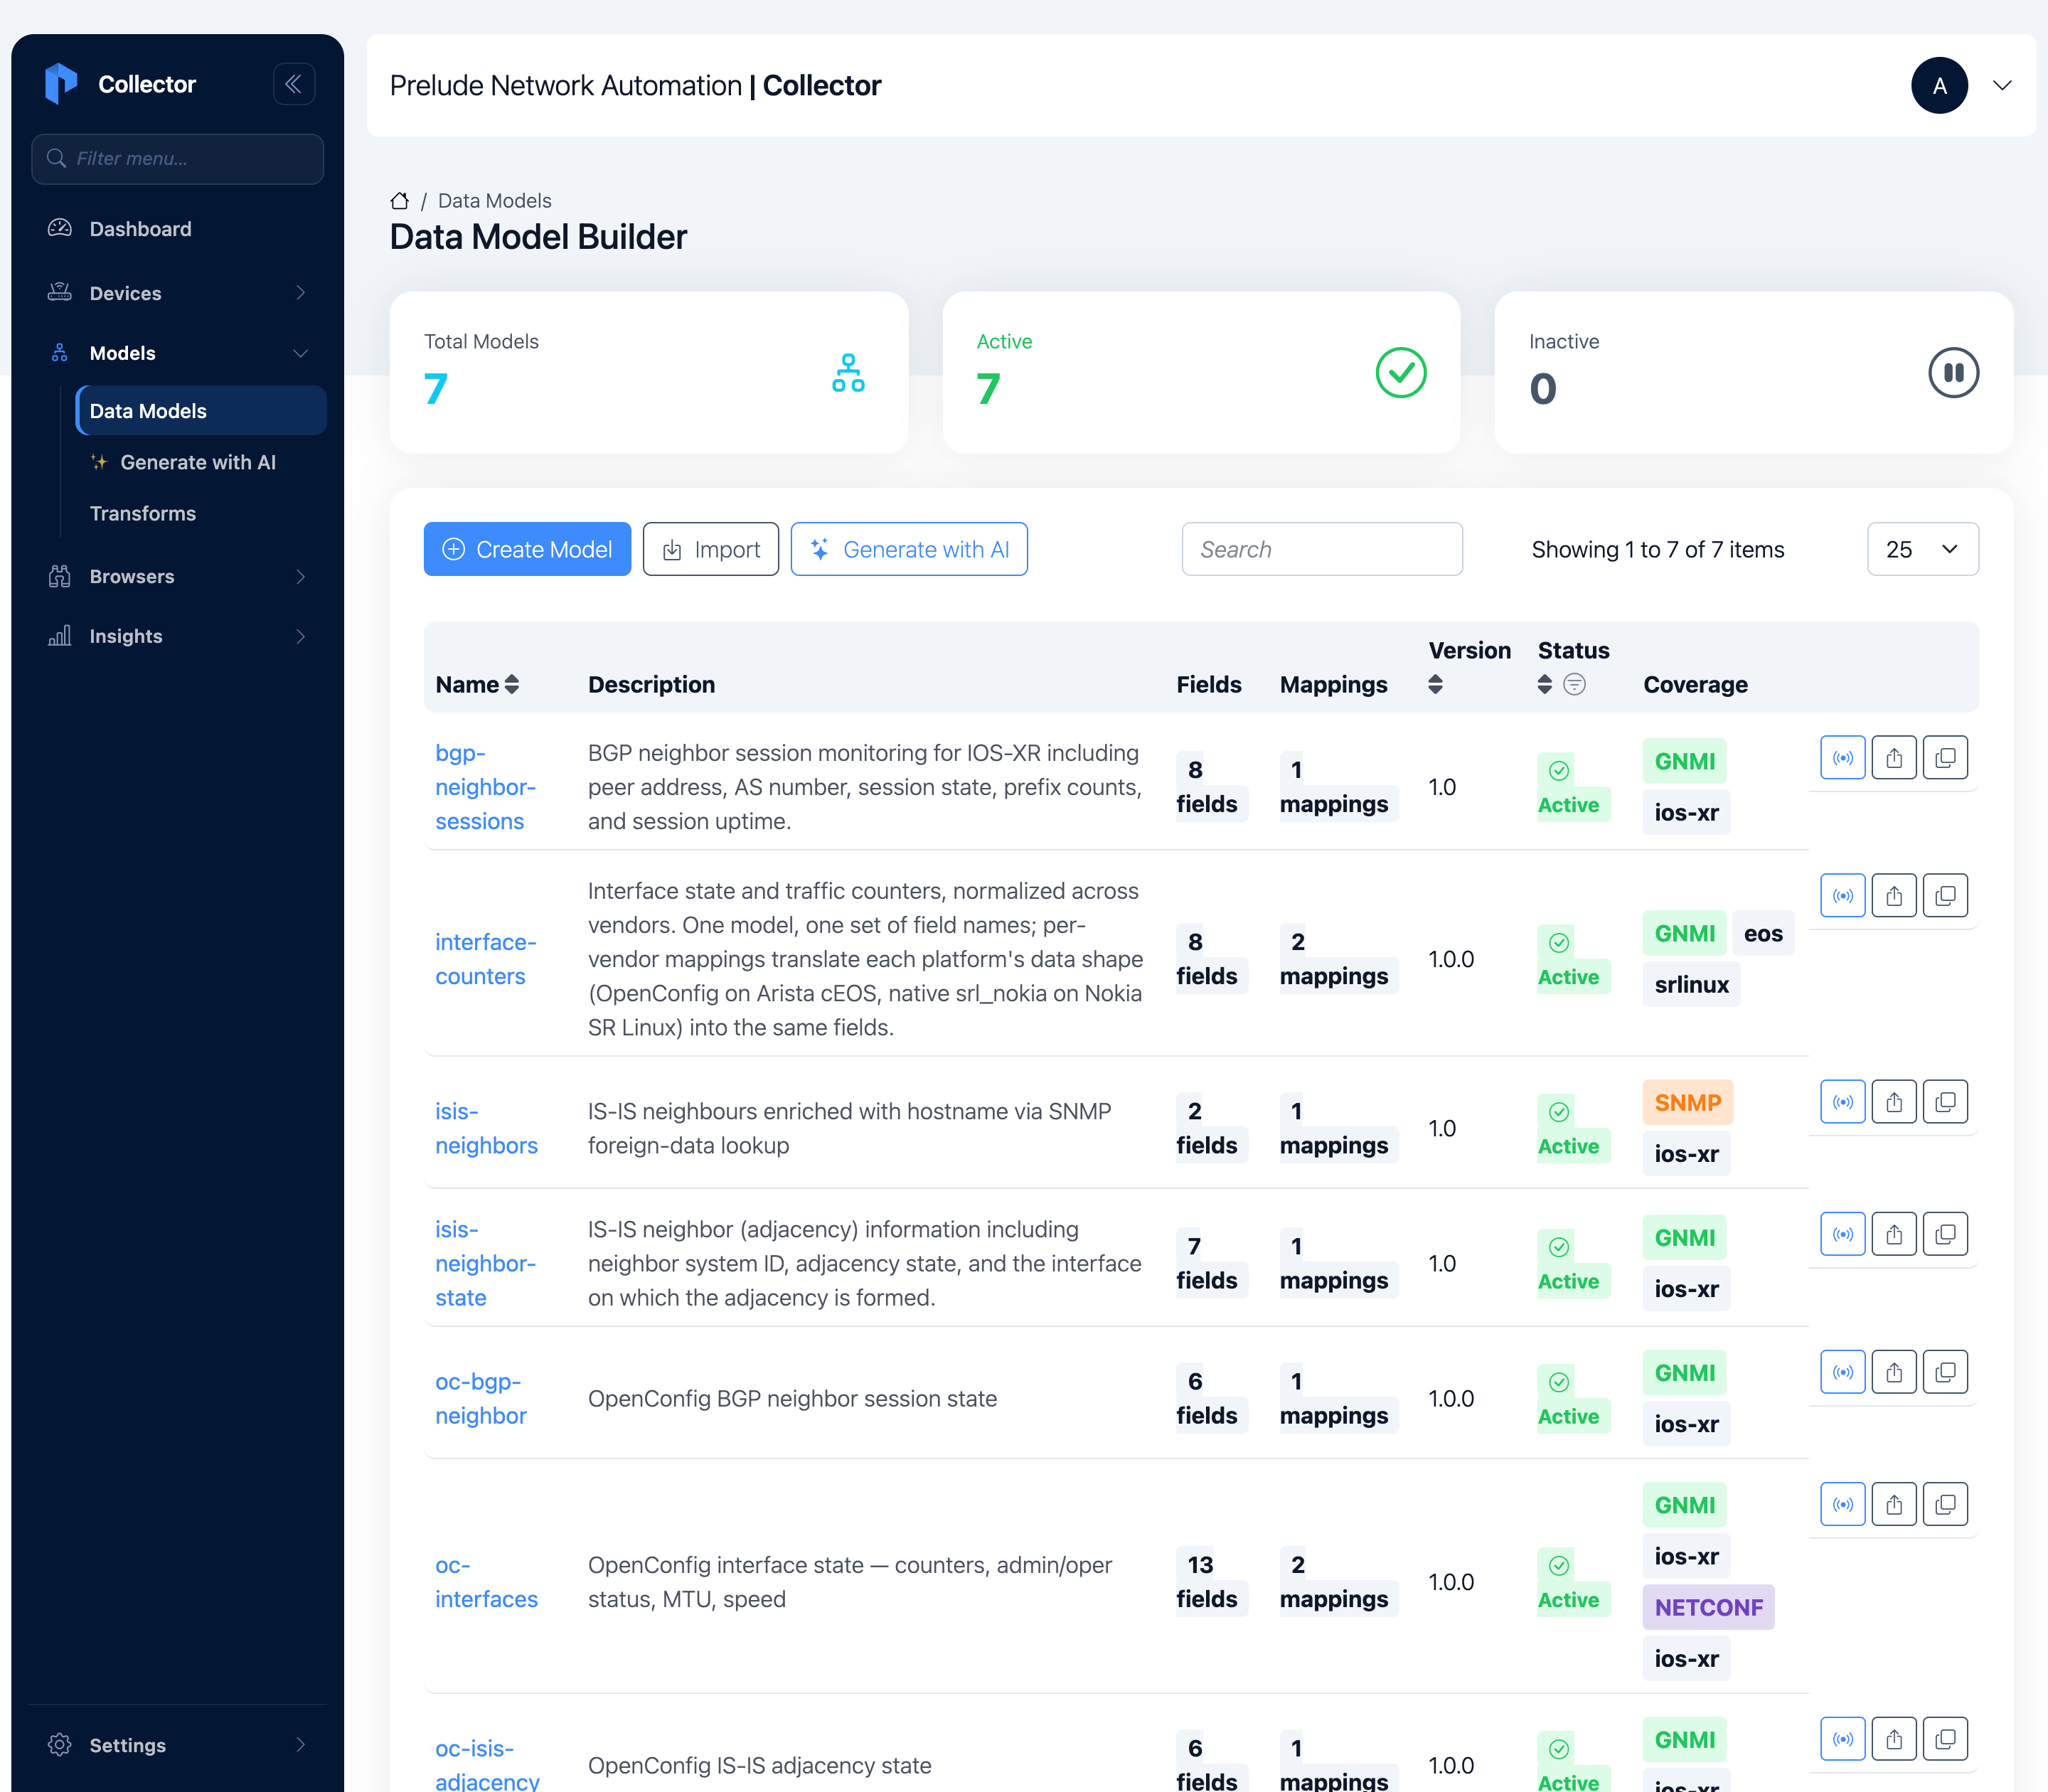
interface-counters now appears in the Data Model Builder with 8
fields, 2 mappings, and coverage badges for both eos and
srlinux.
Open the model. The Fields tab lists the eight vendor-neutral
fields, with interface-name flagged as the key.
The Protocol Mappings tab shows the two mappings, both keyed on
name.
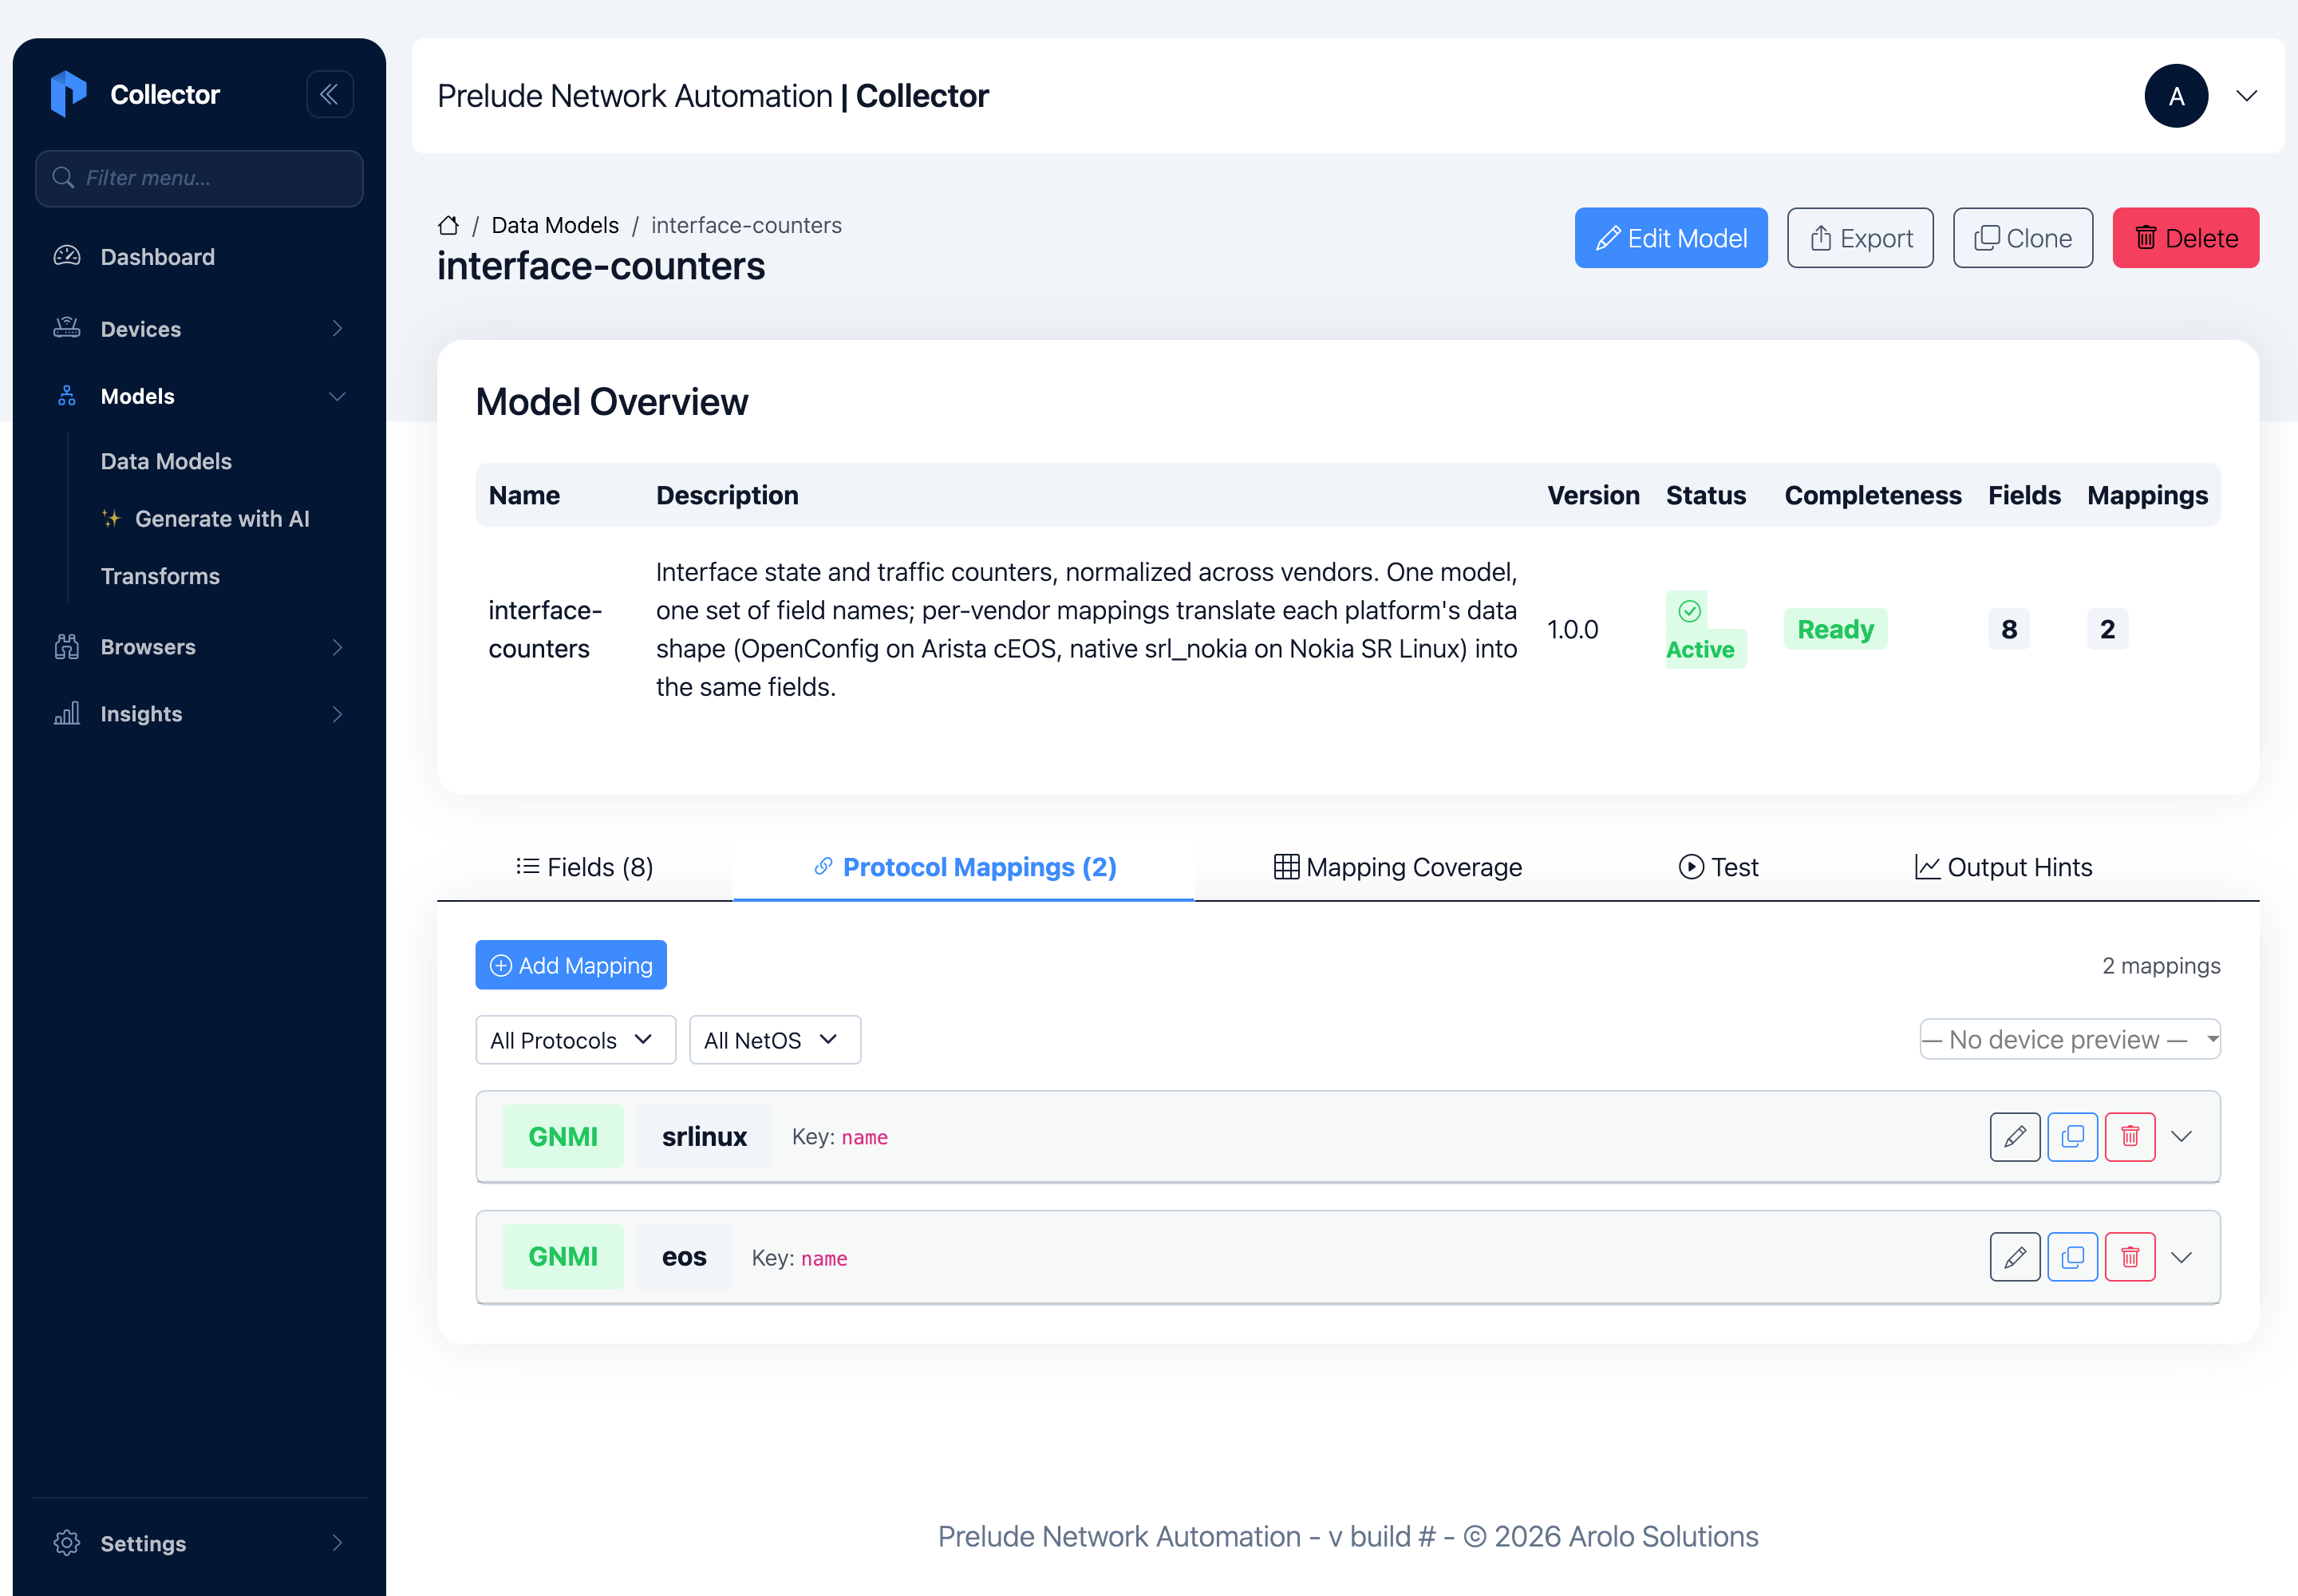
This is where the vendor differences live. Read each mapping's
field-mappings as source-leaf → model-field:
- The eos mapping reads OpenConfig leaves
(
in-octets,out-octets, …) straight off/interfaces/interface/state. cEOS differs from the model only in case (UP/DOWN), so alowercasefield-transform normalizesadmin-statusandoper-statustoup/down. - The srlinux mapping subscribes to the native paths
(
/interface/statistics,/interface/admin-state, …) and pullsin-error-packets/out-error-packetsinto the model'sin-errors/out-errors. SR Linux uses a different vocabulary (enable/disable), which a lowercase can't fix — so it uses a value-transform to renameenable→upanddisable→down.
(That contrast is worth noting: a field-transform runs a function
on the value, like lowercase; a value-transform is an explicit
table of value renames. Field-transforms run first.)
Both mappings use name as the key field — the interface name. On SR
Linux the name isn't a streamed leaf, so the collector reads it from
the gNMI path key ([name=ethernet-1/1]); on cEOS it comes from the
OpenConfig name leaf. Either way, every row is keyed by interface.
Step 3 — Test and compare across vendors
Before starting a long-lived Subscription, confirm the parsing works
on both devices. Open the model and go to the Test tab, then switch
to Compare Vendors. The collector auto-selects one Device per
mapping (your SR Linux node for srlinux, your cEOS node for eos).
Click Run Comparison.
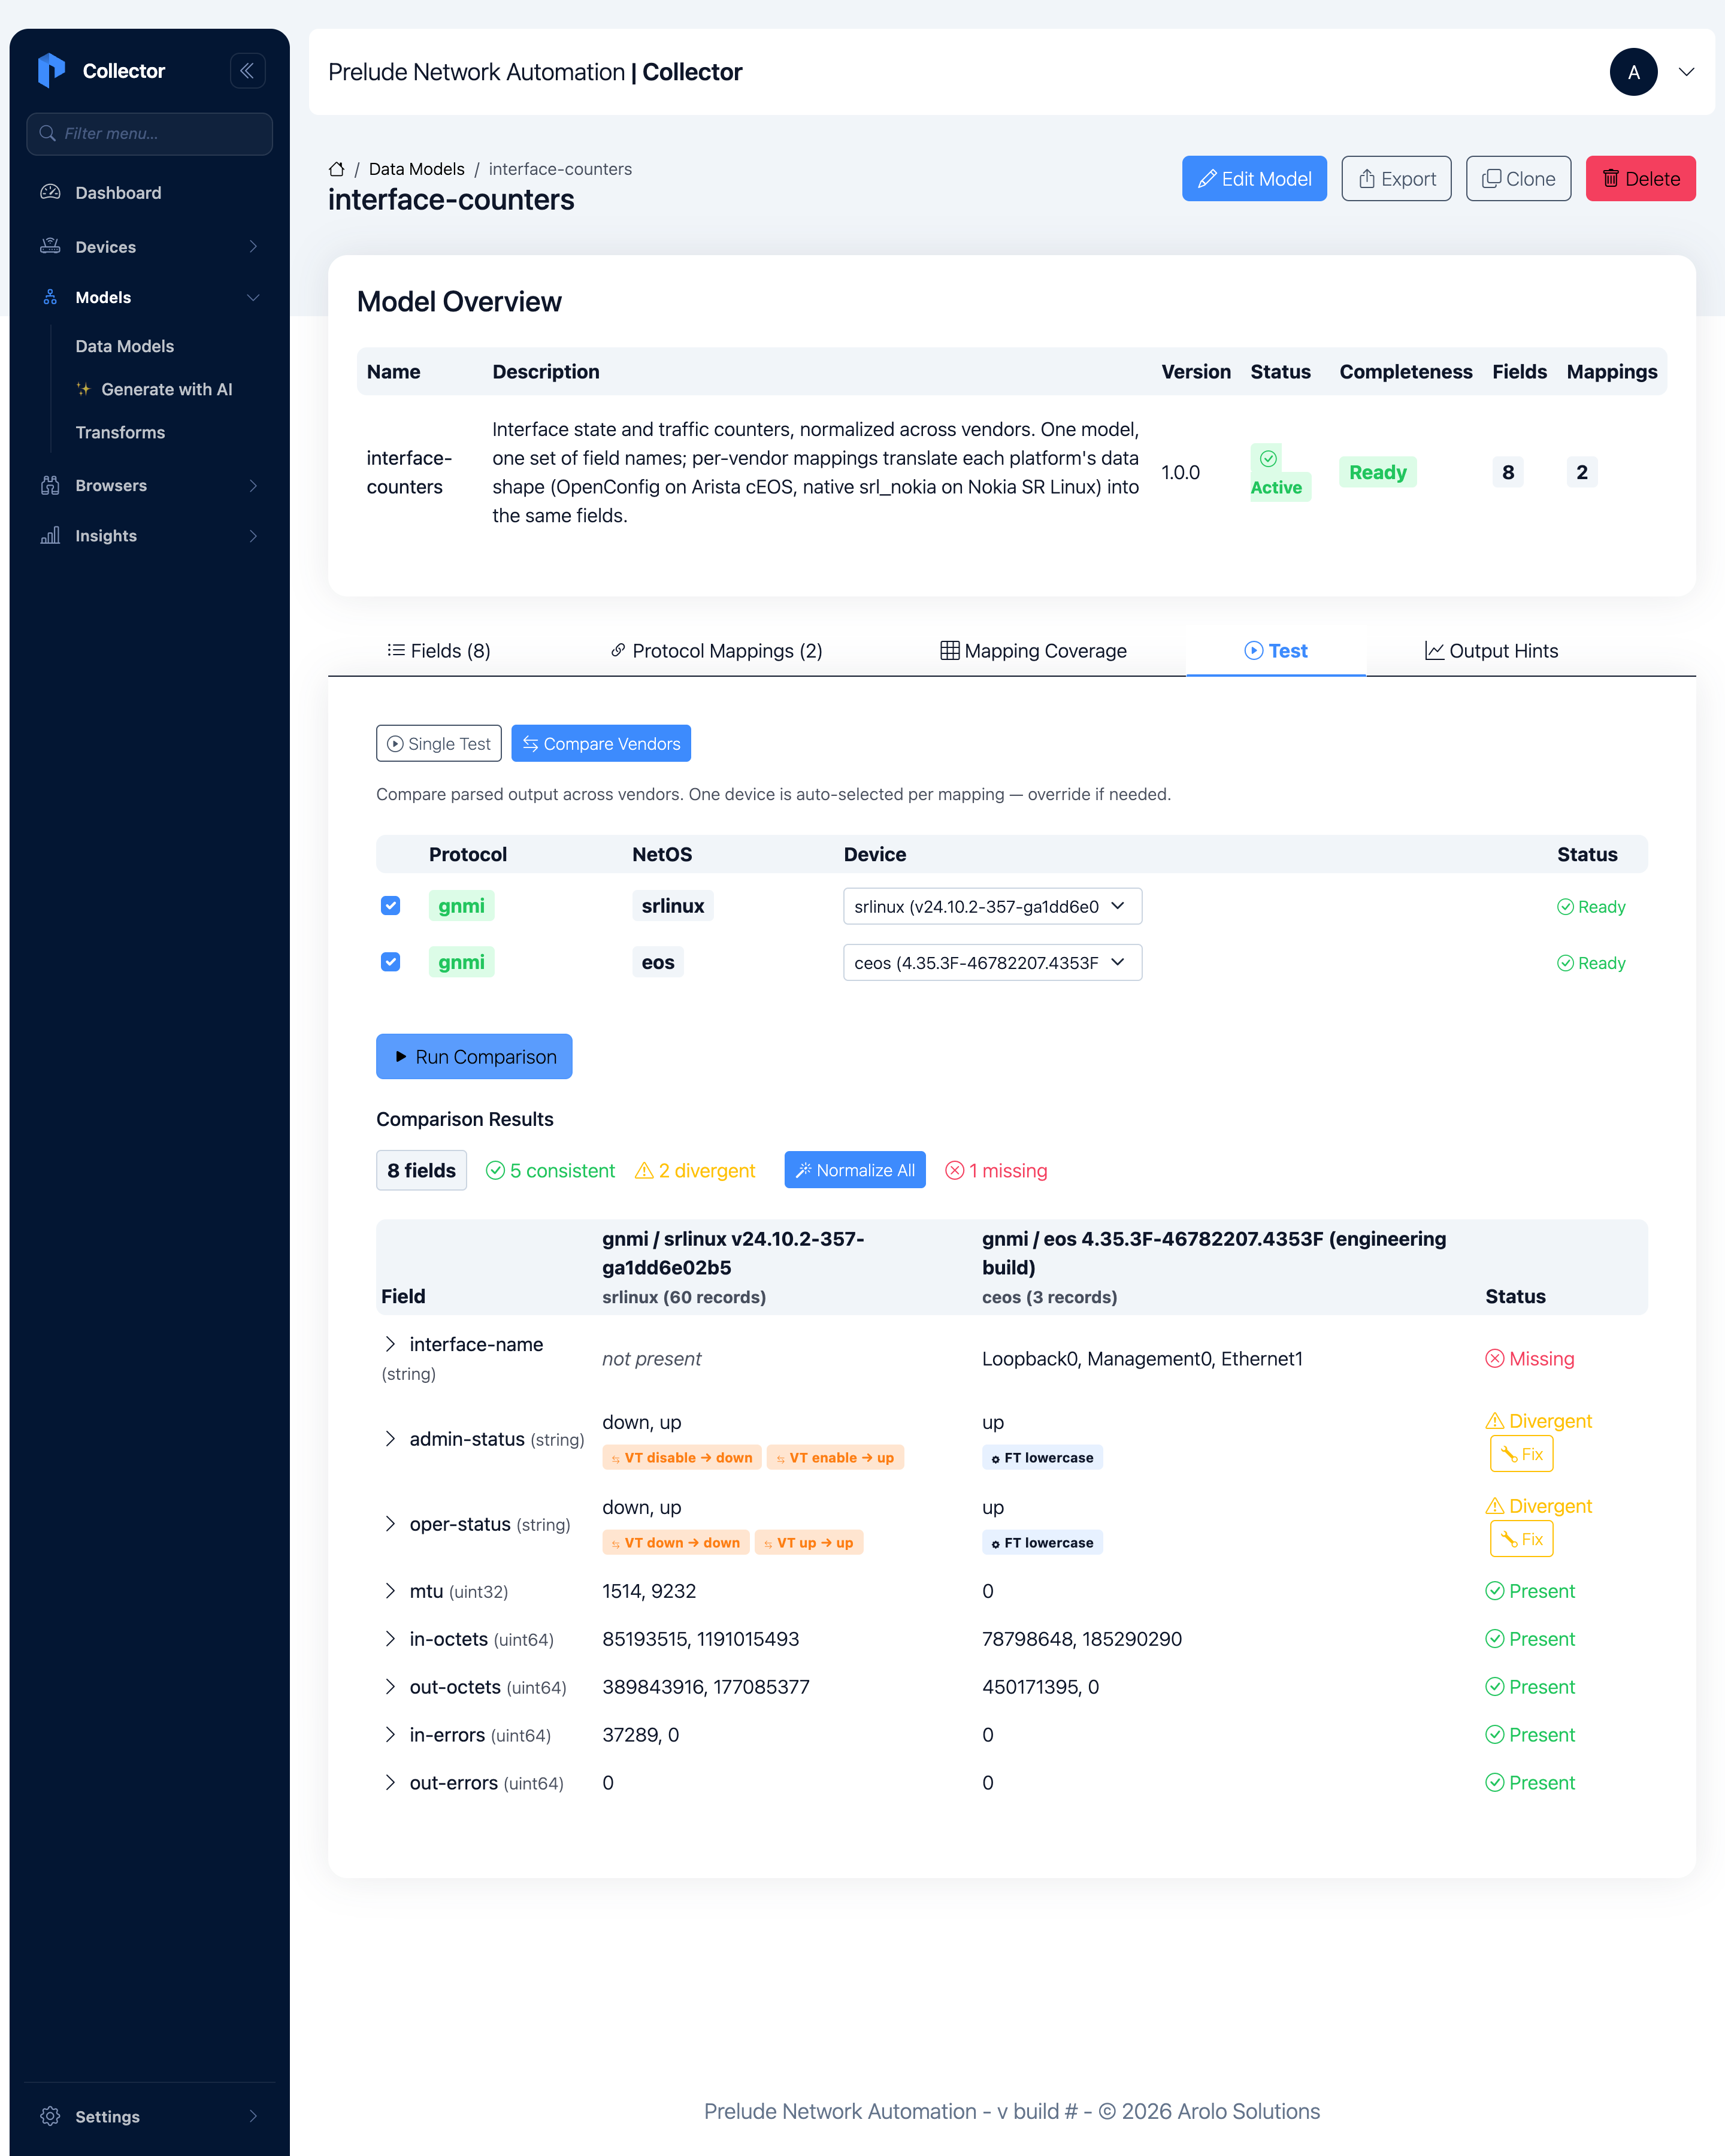
You get a field-by-field comparison of the parsed output from both
vendors. The takeaway is that the field names are identical — both
columns have in-octets, oper-status, and so on — even though the
two devices speak entirely different models. The badges tell you where
the data lines up:
- Consistent — the counters and
mtucome through cleanly on both. - Divergent —
admin-status/oper-statusdiffer only because SR Linux has both up and down ports while the cEOS links are all up; the transform badges show the raw enums being normalized toup/down. - Missing —
interface-nameshows as a field only on cEOS. On SR Linux the interface name is the row key (you'll see it in Step 5), not a separate leaf — a real, harmless vendor difference.
Step 4 — Start a subscription on each device
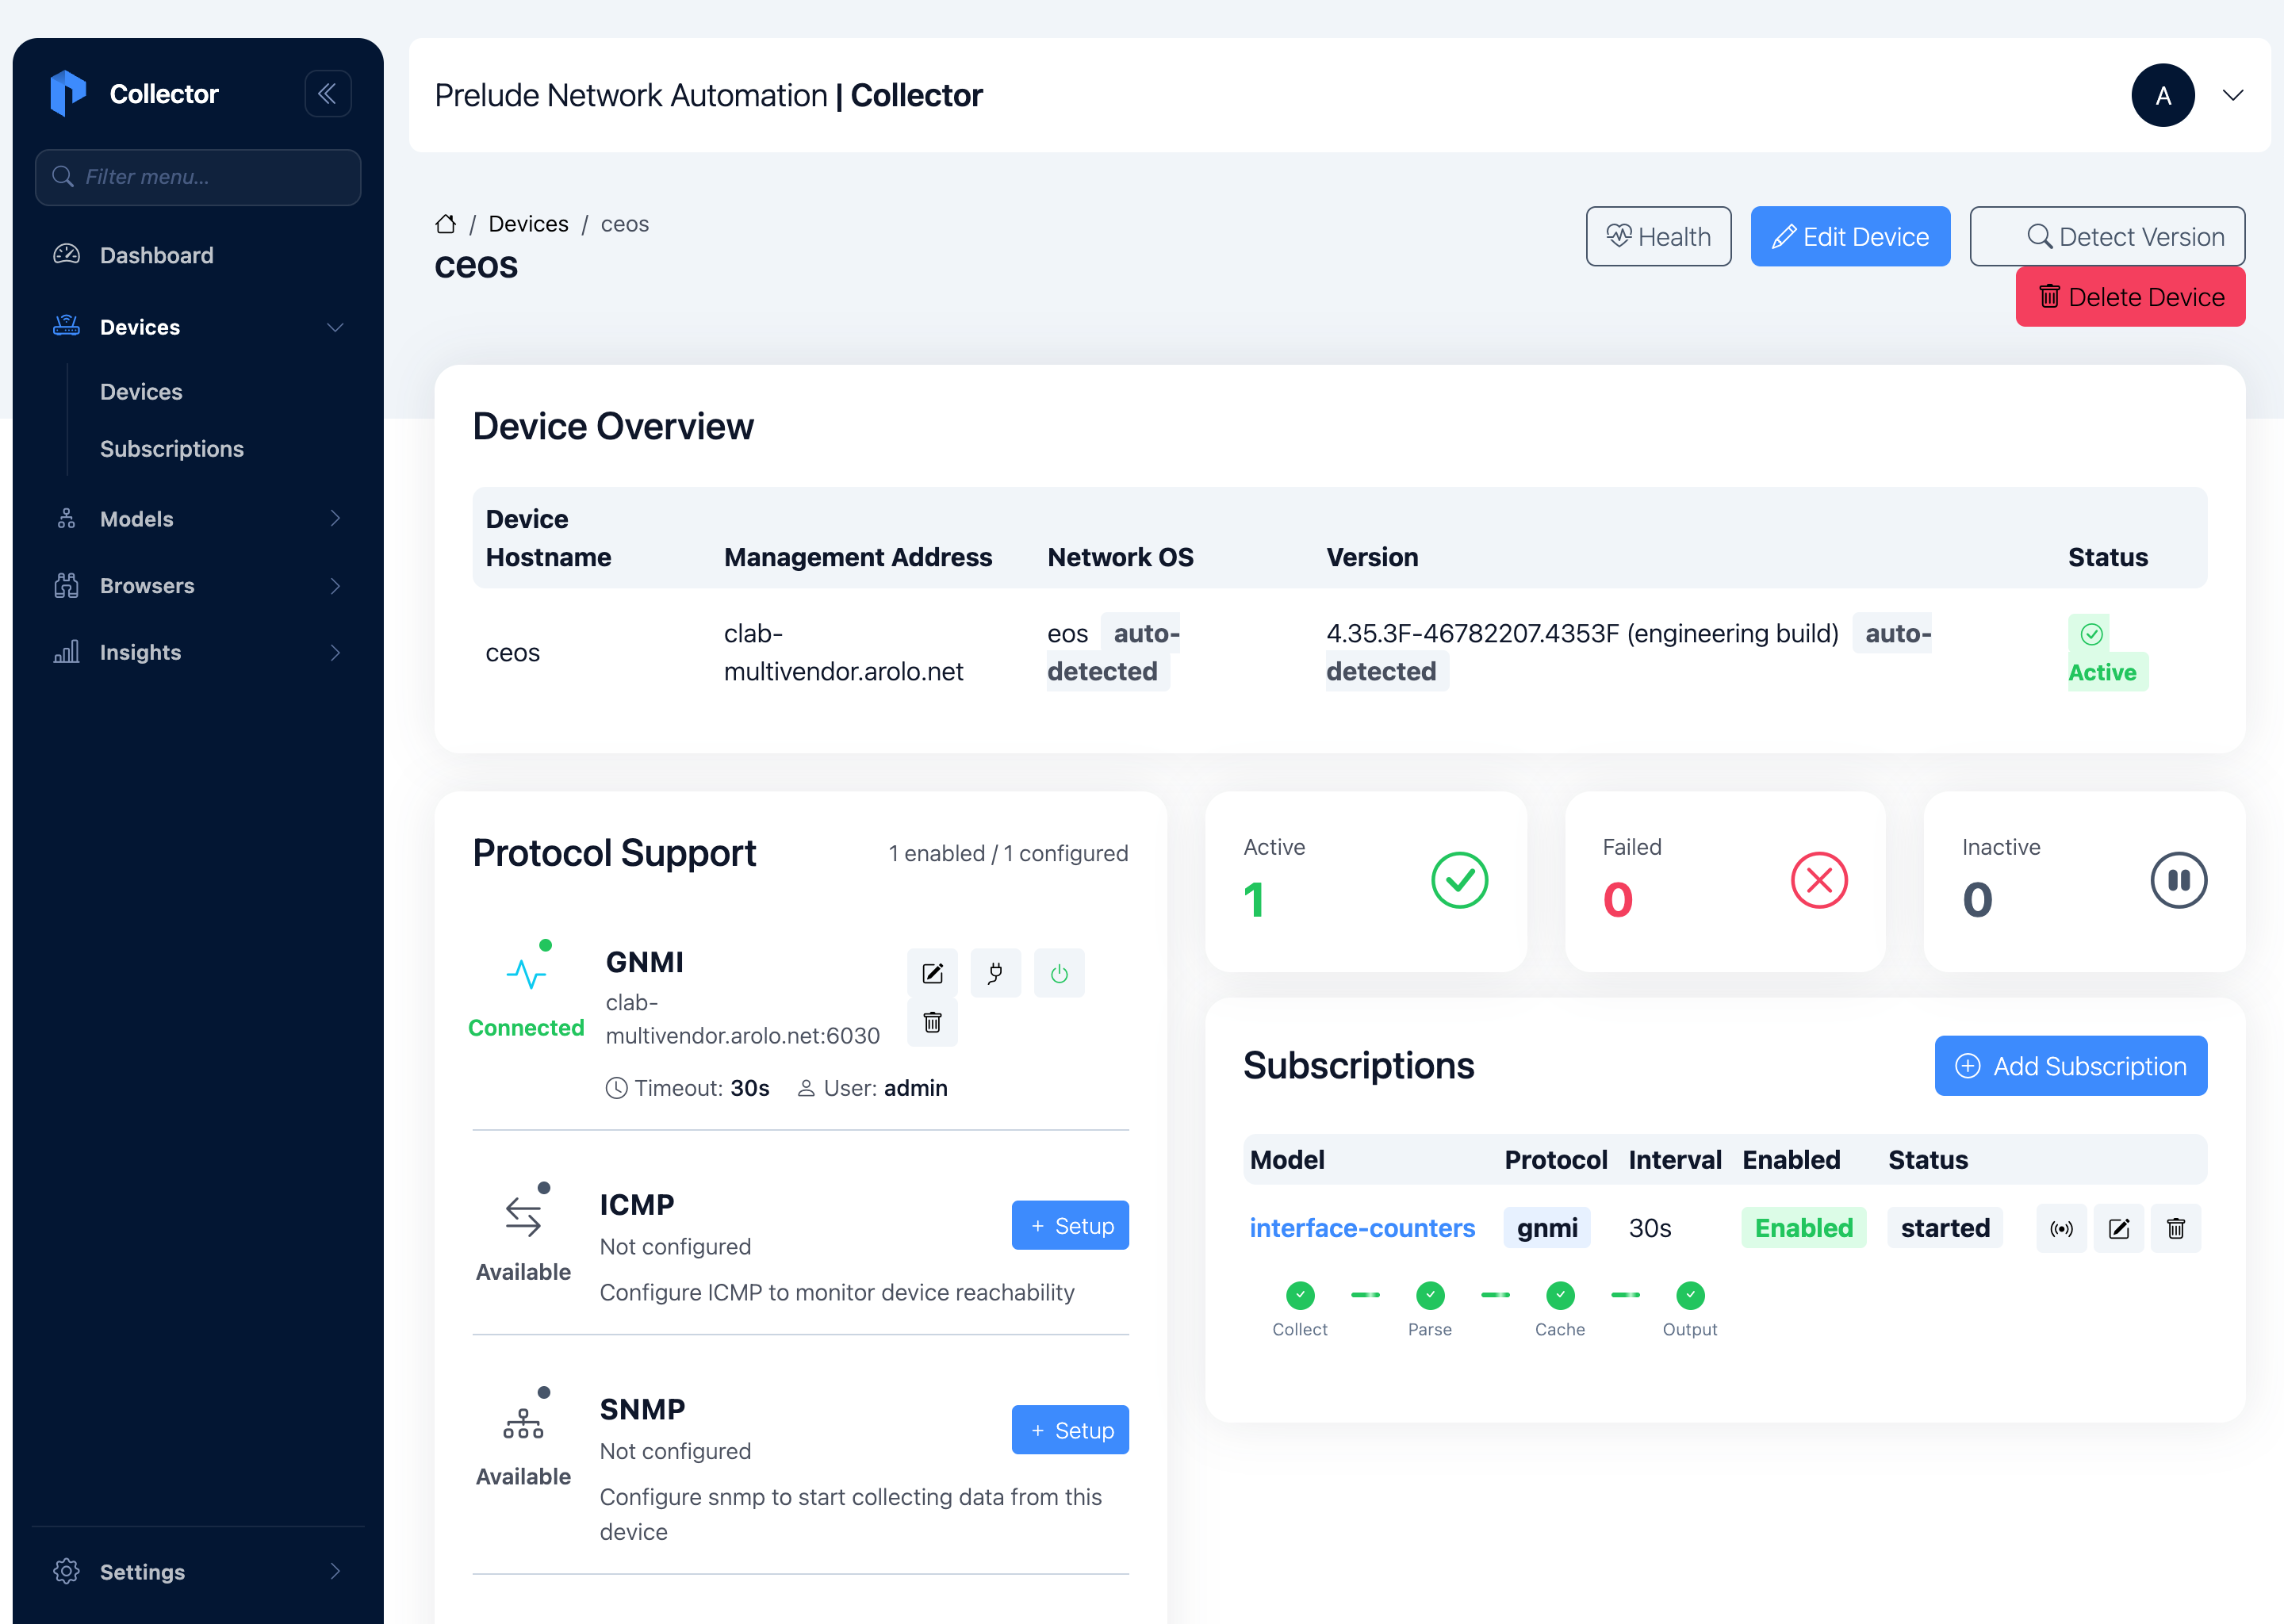
Now stream it. On each Device's detail page, click Add
Subscription, pick the interface-counters model over gNMI, and
save. Within seconds the subscription moves to started, gNMI flips
to Connected, and the per-stage pipeline (Collect → Parse → Cache →
Output) lights up green.
Step 5 — Read the collected data
Open Insights → Data Explorer and filter the Model to
interface-counters. You'll see rows from both Devices landing in
the same Model, each keyed by its interface — Ethernet1,
Management0 from cEOS; ethernet-1/1, mgmt0, ethernet-1/2, … from
SR Linux. Click View data on any row to see the normalized payload.
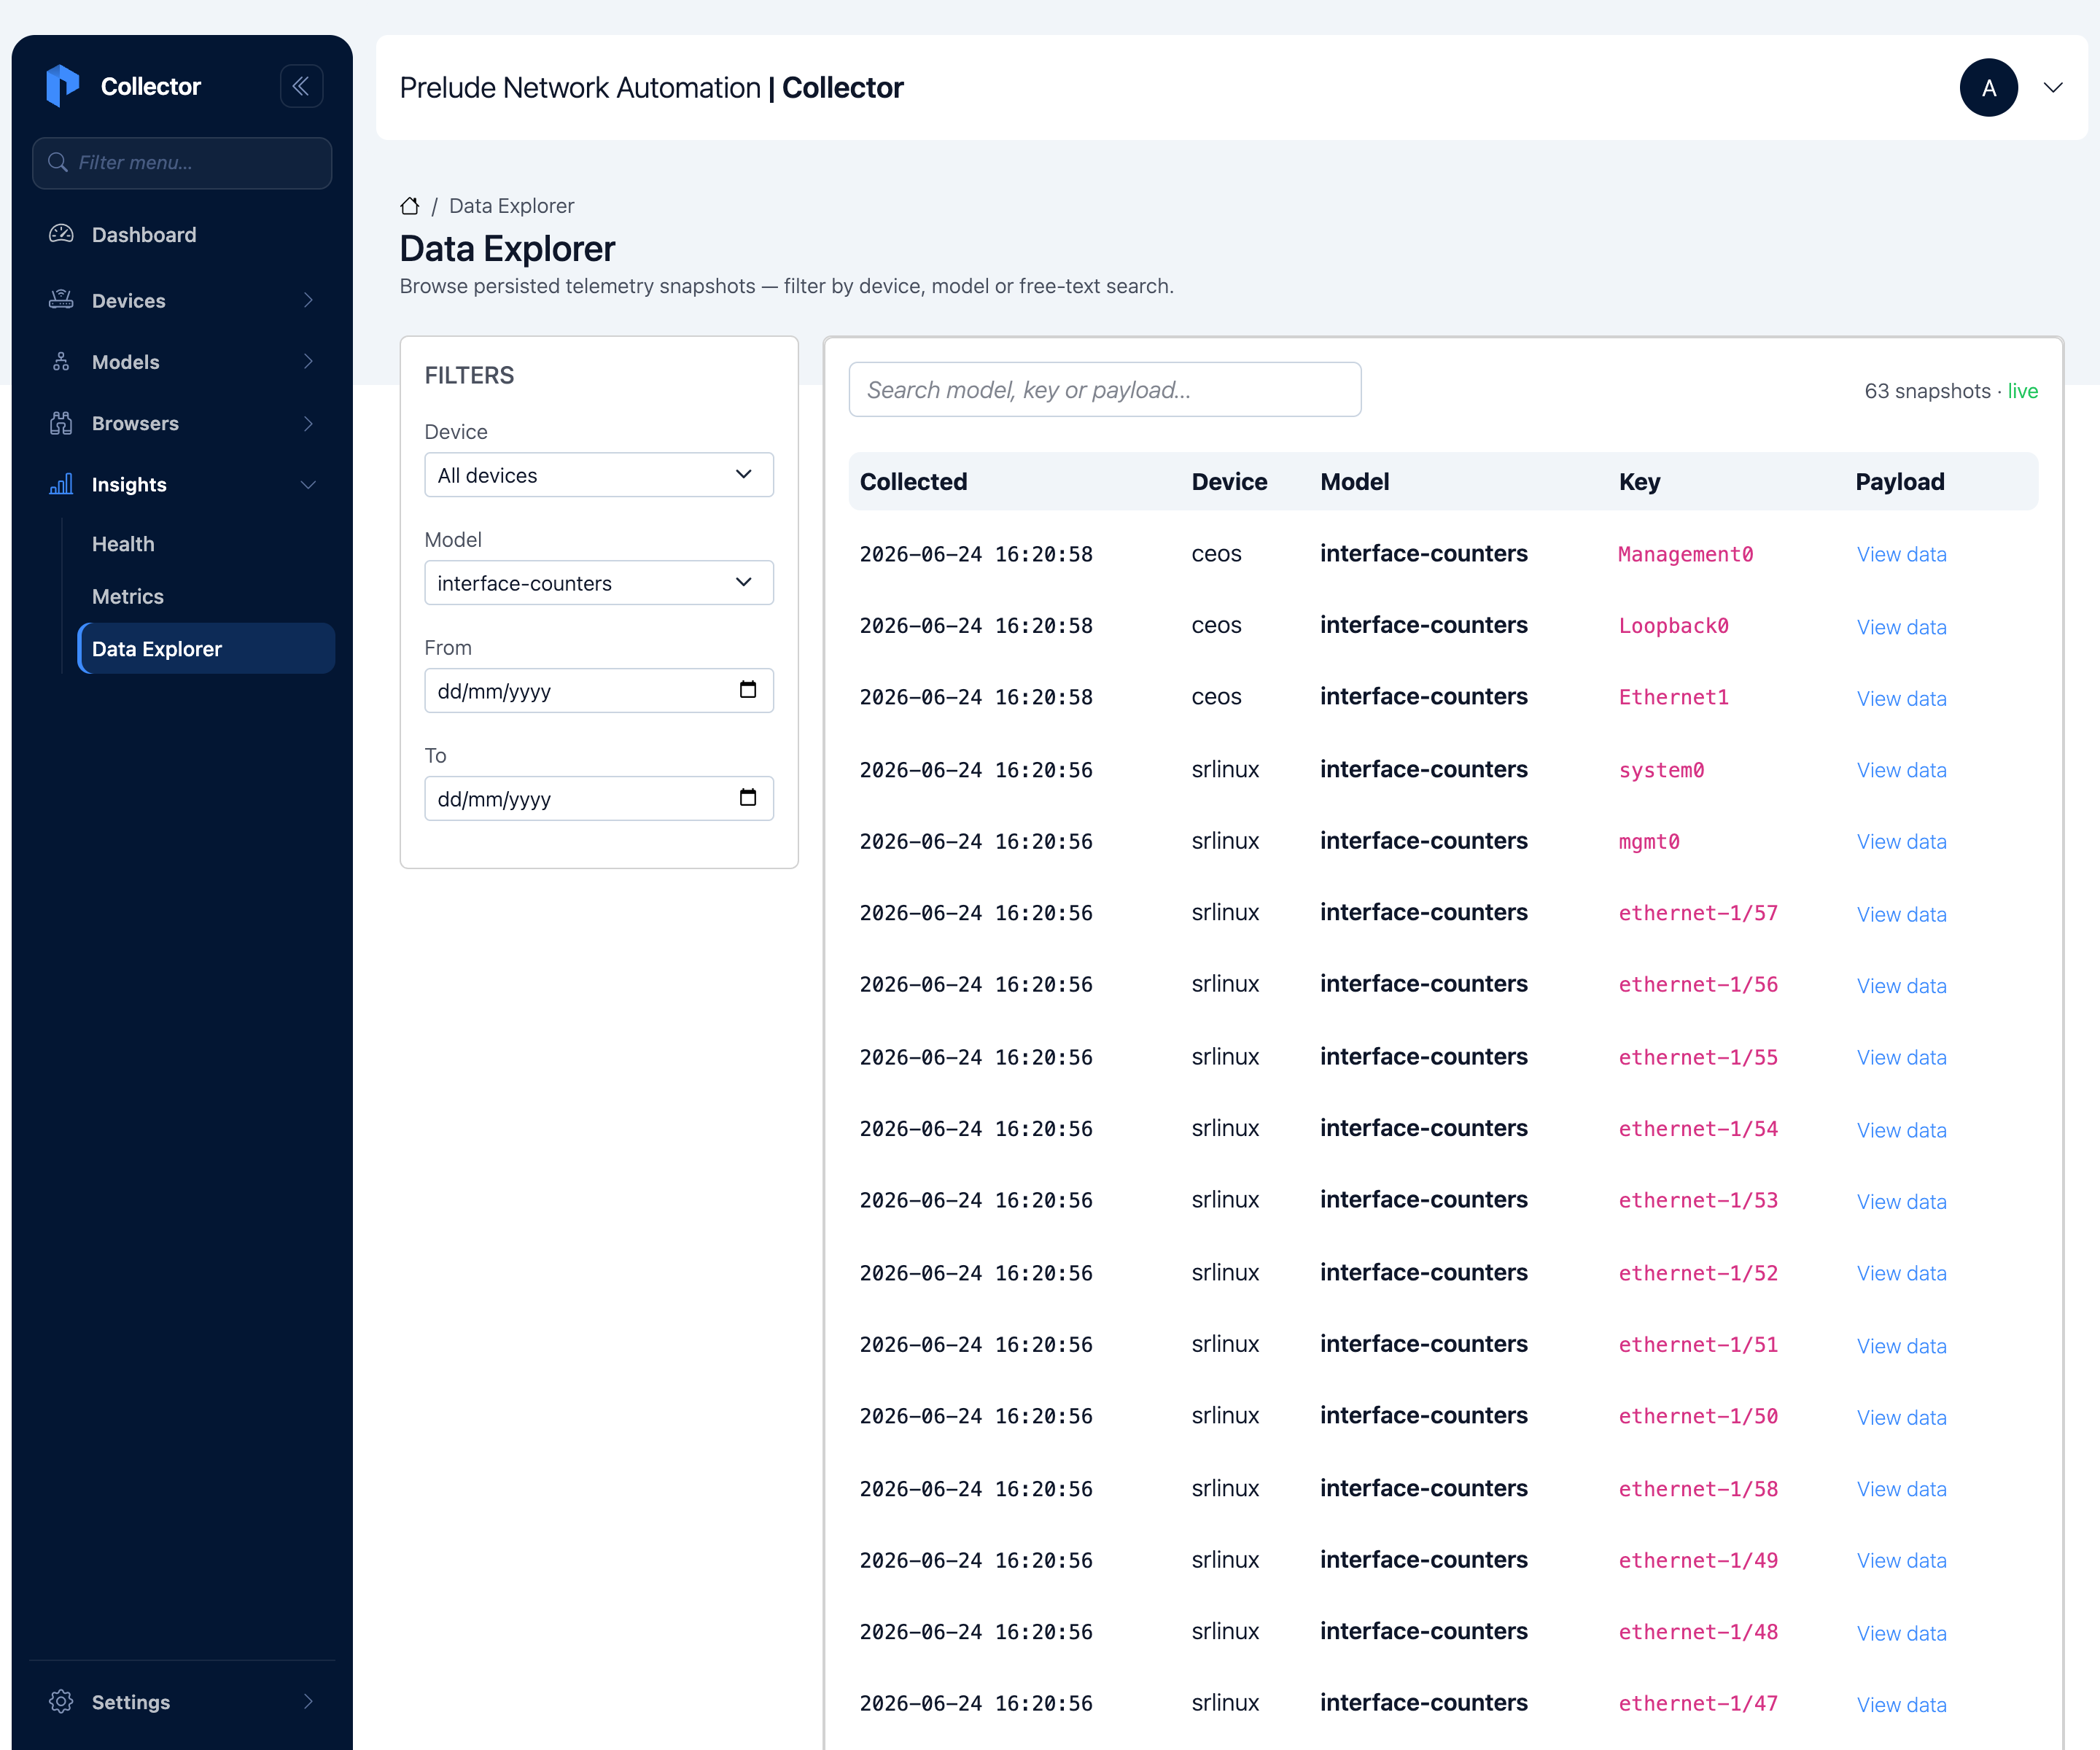
Whichever vendor produced it, every row carries the same eight fields. Downstream code only has to know the Model.
Verify it works
You're done when:
- [ ] The Devices list shows both Devices Active with gNMI.
- [ ] The
interface-countersmodel shows 8 fields and 2 mappings. - [ ] Compare Vendors returns parsed rows for both Devices under the same field names.
- [ ] Both Subscriptions are started and the pipeline stages are green.
- [ ] The Data Explorer shows rows from both Devices under
interface-counters, keyed by interface.
Where the dashboards plug in
Because both vendors write the same shape, downstream dashboards don't
need to know about vendors at all. With the Prometheus output (the
default), each numeric field becomes a gauge labelled by device and
key — and key is the interface name for both platforms — so a
single Grafana panel filtered on the model graphs traffic from both
vendors, with the device name distinguishing them.
The string fields (
admin-status,oper-status) are dropped from Prometheus by default; set their Prometheus role toinfoon the model's Output Hints tab to surface them as labels. To get cleanrate()on the octet/error counters, set those fields' role tocounter.
See Send data to Grafana for the full output setup. The same approach works for InfluxDB, Kafka, or webhook outputs.
Adding a third vendor later
Onboard the new device, then open the model's Protocol Mappings tab
and click Add Mapping. Set the protocol to gNMI, the Network OS to
the new platform (ios-xr, junos, …), the key field, the paths that
platform exposes, the source-leaf → field bindings, and any
value-transforms for its enum casing. Save, then add a Subscription on
the new Device.
No dashboard or output change is needed — the collector picks the new Mapping based on the Device's Network OS and writes into the same shape. (Prefer to keep it in version control? Export the model from its detail page, add the mapping to the JSON, and re-import it under a new name.)
Where to next
- Send data to Grafana — graph what you just normalized, with the device label cleanly distinguishing vendors in one panel.
- Custom Starlark transform — add derived fields (utilization percent, flapping flag) to the normalized rows.
- Concepts: Data flow — the order in which Protocol, Mapping, Transform, and output stages run.